
by Chris A. Knobbe, MD
Founder, Cure AMD Foundation
Associate Clinical Professor Emeritus, Ophthalmology
One attribute of the supportive research for the hypothesis that AMD is caused by processed food consumption, is that AMD was a rare disorder, most certainly, between the years 1851, when it was first discoverable, and about 1930. In fact, no more than about 50 cases of AMD existed in all the world’s literature, before 1920, yet there were at least 200 different models of ophthalmoscope available worldwide, by 1913, as shown by ophthalmologist, Landolt, that year.[1] That is, ophthalmologists were examining the retina regularly, worldwide, and they were dilating eyes regularly by the 1880s, with six different dilating agents in use by that decade, yet AMD was notably absent from most textbooks of ophthalmology and scientific papers up until the 1930s.
This aspect of the research, that is, that AMD was once a medical rarity, is by no means the only evidence that processed food consumption is the cause of this disease. In fact, the evidence is extraordinary, in my opinion; hence the reason for my book, Ancestral Dietary Strategy to Prevent and Treat Macular Degeneration.
For those not familiar with my hypothesis, it is this: The ‘displacing foods of modern commerce’ are the primary and proximate cause of age-related macular degeneration.’
To understand just the bare fundamentals of this hypothesis, wherein the term ‘displacing foods of modern commerce’ was derived, and how these manufactured, processed foods are the causative agents of numerous diseases of civilization, including macular degeneration, you might want to read the Introduction and even my book!
Now, back to the purpose of this article. A few of the detractors of this hypothesis, i.e, that age-related macular degeneration (AMD) is a disease of processed food consumption, use the old canard that, ‘But, we just didn’t live long enough to get AMD back in the 19th century.’
Is this true? Was the life expectancy so low, that just virtually ‘no one’ lived to be old enough to get AMD, in the years 1851 to 1930?
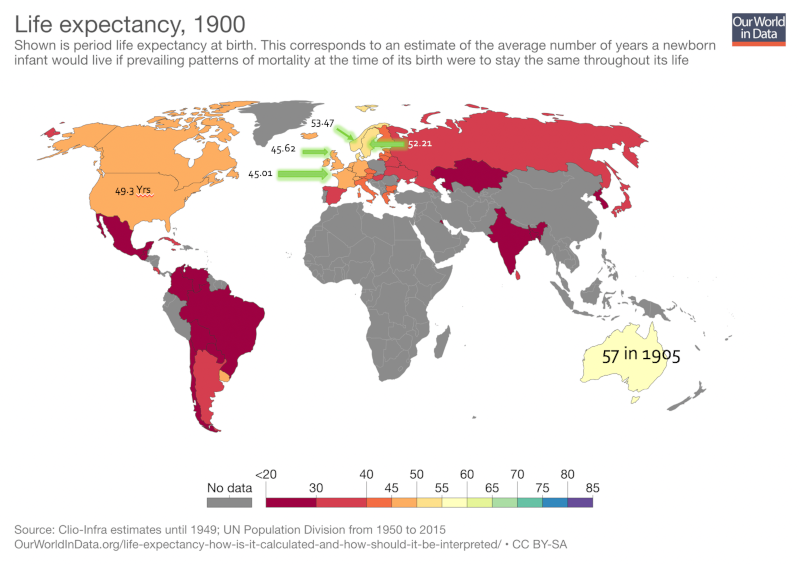
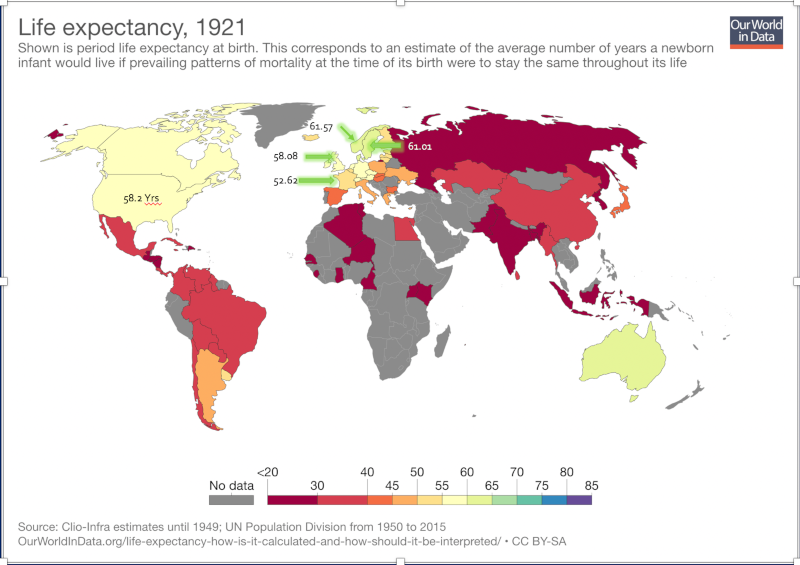
Well, let’s first take a look at life expectancy, in the years 1900 and 1921. On the data maps there are legends that indicate the life expectancy by color for each country where there is data. I’ve placed the exact figures for those countries ranking amongst the longest life expectancies, specifically, the U.S., France, U.K., Norway, and Sweden.
I’ve heard this assertion, i.e., that ‘we didn’t live long enough to develop AMD back then,’ a few times over the past couple of years since introducing the hypothesis and, as such, I’ve decided to address the argument, or question, directly.
First, the reason that this argument exists at all, is that many people don’t understand the difference between lifespan, perhaps better called ‘maximum lifespan,’ and life expectancy. Though I’ve understood the fundamental concepts for decades, I too am guilty of mis-using the terms. Here, I’ll use the terms and definitions, accurately I hope, for the first time.
As stated in Wikipedia, “Life expectancy differs from maximum life span. Life expectancy is an average for all people in the population including those who die shortly after birth, those who die in early adulthood (e.g. childbirth, war), and those who live unimpeded until old age. Lifespan is an individual-specific concept maximum lifespan is therefore an upper bound rather an average.” [2]
Life expectancy is, therefore, a statistical measure of the time an individual is expected to live, based on numerous factors including the year of birth, current age, gender, and other demographic factors. The most common use of life expectancy is the measure of life expectancy at birth, also known as LEB.
Lifespan, generally inferred to mean maximum lifespan, is the period of time that an individual would live if they didn’t succumb to conditions that could result in an early demise. These ‘conditions’ would include infectious diseases, trauma, warfare, accidents, poisoning, etc. We might think of lifespan as the term we would use if we had a perfectly healthy life and died of ‘old age.’
The oldest confirmed age for any human is currently 122 years and 164 days, which was the age at death for the French-born Jeanne Calment, who lived from 1875 – 1997.[3] This is likely is the absolute maximum lifespan for humans.
Understanding Reduced Life Expectancy, Around the World
In Swaziland, Africa, LEB is currently only 49 years, whereas in Japan, LEB currently is 83 years.2
Why the drastic differences?
Swaziland, with 26% of adults affected with HIV and most progressing on to develop AIDS, along with widespread tuberculosis, alcohol and cannabis abuse, sexual violence, and poverty, the otherwise normal life expectancy is drastically reduced. This is an example of such a population of very short life expectancy at birth, but otherwise typical lifespan.
Today, poverty alone is strongly associated with chronic diseases and shortened lives, as I’ve shown in my lectures.
This is true, at least in the U.S. and most all developed nations, because processed food is far less costly than is whole food — whole food being meats, fowl, fish, eggs, dairy, fruits, vegetables, whole grains, nuts, and seeds. And those people consuming the most processed foods also have the most heart disease deaths, stroke, cancer, type 2 diabetes, hypertension, obesity, and severe vision loss, the bulk of which 54 percent is due to macular degeneration.1
As Weston A. Price showed, way back in the 1930s on five continents, wherever there are roads, there is man-made, processed, nutrient-deficient food, in the form of refined white wheat flour, sugars, canned goods, sweets, confectionary, and vegetable oils. These are the foods he called the ‘displacing foods of modern commerce.’ And as he discovered, for those who chose to begin consuming the displacing foods, as opposed to their native, traditional foods (whole foods, essentially), they began to develop dental decay and chronic, degenerative diseases such as arthritis and cancer, and they lost immunity to infectious diseases such as tuberculosis.[4]
Now if we contrast the situation in Japan to that of Swaziland, Japan is among the most highly educated countries in the world, with one of the highest percentages of citizens holding university degrees. The nation is extremely well developed and has an extremely high standard of living. Japan is ranked as the world’s third largest economic force, based on nominal GDP. This is a strong indication of general prosperity. The people enjoy the highest life expectancy in the world again, 83 years and the lowest infant mortality rate in the world.[5] And as our research has shown, though they’ve Westernized their diets significantly since the 1960s, they consume far more native, traditional foods than many other developed nations.[6] For example, in recent years, they consume roughly half the sugar and vegetable oils, as do typical Americans. Sugar and vegetable oils are not only dangerous and deadly processed foods in and of themselves, but they’re also ‘proxy markers’ for processed foods.
Hopefully, even if this concept is entirely new to you, you’re beginning to see that processed foods have a causative role in numerous ‘diseases of civilization,’ including, as I’ve presented, macular degeneration.
On a worldwide basis before about 1950, life expectancy at birth (LEB) was drastically reduced, due to epidemics, plagues, wars, accidents, infectious disease, and death to both mother and child, in childbirth.
In the year 1900, the top three causes of death were all infectious: Pneumonia (or influenza), tuberculosis, and gastrointestinal infections. Coming in at the fourth leading cause of death that year, was heart disease. But this was clearly not atherosclerotic disease, that is, coronary artery disease, as the New England Journal of Medicine article clearly denoted that in 1912, “Doctors struggled with… heart disease (chiefly infectious or valvular rather than atherosclerotic)…” [7]
However, in 2010, seven of the top ten causes of death are chronic metabolic and degenerative diseases, in the form of atherosclerotic heart disease (heart attacks, congestive heart failure, etc.), cancer, noninfectious airways disease (chronic obstructive pulmonary disease, or COPD), cerebrovascular disease (stroke), Alzheimer’s disease, type 2 diabetes, and kidney disease.[8]
The graphic below, from the New England Journal of Medicine (referenced above), clearly delineates these causes of death at the two points in time, just 110 years apart (1900 versus 2010).
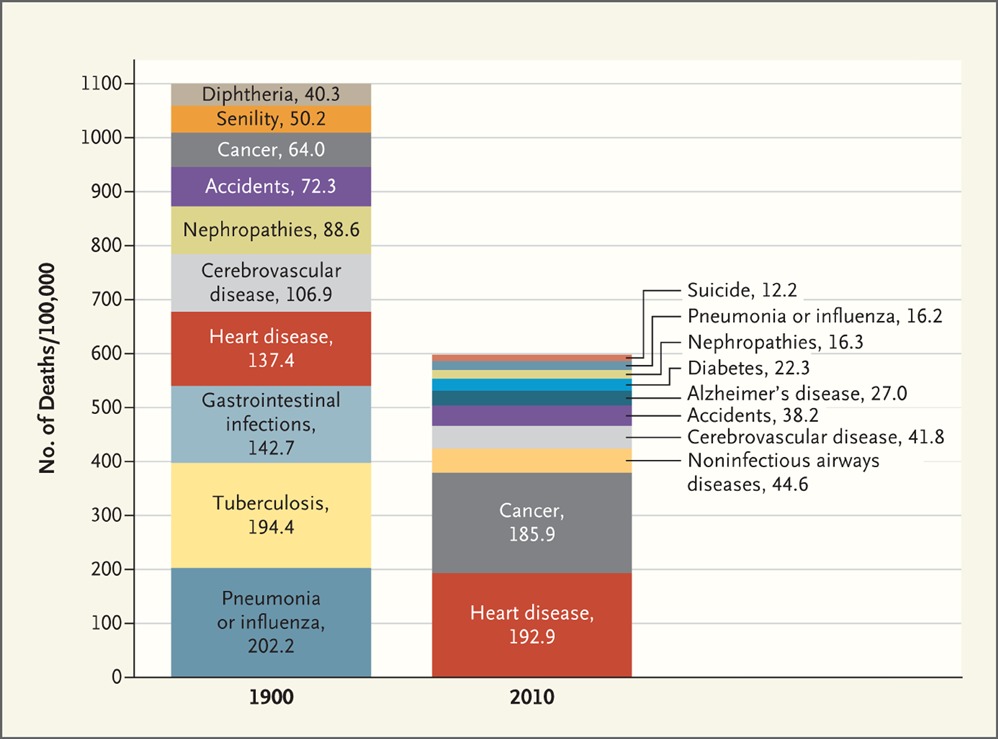
In other words, diseases such as atherosclerotic heart disease, cancer, COPD, Alzheimer’s disease, type 2 diabetes, etc., were all either rare or very uncommon in 1900, yet commonplace today. As I have frequently alluded to, as have many other nutrition researchers, these are ‘diseases of civilization,’ that are common to populations consuming Westernized diets.
Notably, as Loren Cordain and S. Boyd Eaton have shown, these diseases remain rare or virtually absent among hunter-gatherer populations.[9]
Regional Life Expectancy Differences & Economic Circumstances
The World Health Organization (WHO) has determined the “social determinants” of health, and the BBC News reported this with the sub-headline, “Social factors – rather than genetics – are to blame for huge variations in ill health and life expectancy around the world, a report concludes.”
This all comes down primarily to food choice, lifestyle, access to clean water, sewerage, economic circumstances, and medical care. All of these, of course, are intimately related.
One extreme example of this effect of poverty versus affluence on life expectancy in our modern world exists in Glasgow, Scotland. In the severely impoverished Calton area, life expectancy for males is 54, which stands in stark contrast to the life expectancy of 82 in the affluent area of Lenzie, which is just 8 kilometers (5 miles) away.[10]
In a similar way, in London’s wealthy Hampstead, life expectancy is 11 years longer than in nearby St. Pancras.9
A girl born in Lesotho, Africa, is likely to live 42 years less than a girl born in Japan.9
Now, after that digression, let’s get back to life expectancy and lifespan so that we can, hopefully, dispel the myths and understand the statistics in a meaningful way.
Hypothetical Population Examples of Life Expectancy
Consider this: In a hypothetical population in which 40% of the children die at age two years, but the other 60% of the population survives to age 80, the life expectancy at birth is still only 48.8 years. This example is strongly indicative of the situation in the U.S. during the 19th century. Shortly, we’ll examine why.
I have listened to highly intelligent physicians, health practitioners, and others, who mistakenly conclude, and might I say, with gross misrepresentation, that populations with an average life expectancy of fifty, have very few old people. I could quote a few such remarks and writings on the subject, even made to me, but I’ll not disparage these often well-intentioned people.
In any case, one should never, ever conclude that a population with a LEB of only 50, for example, has few people over the age of 70. If that population has a high infant and childhood mortality rate, a high death rate from infectious disease, trauma, warfare and the like, 20% or more of the population might still be surviving beyond age 70. And generally, very few people in the population will be dying around the age of 50, rather, many will die at very young ages and a smaller segment will live into their 70s, 80s, and beyond.
Let’s also dispel the myth that people just mysteriously “got old” at an early age in previous centuries and that if they were in their late 40s or 50s, that they were just old and dying. This is an absolute fallacy. The proof is coming up.
I’ve often thought of it this way, given the research that I’ve done: If a man lives to be 80, but his only son dies at age 2, the life expectancy of this family of two is just 41 years. If in the same scenario, the man has a wife who dies at age 70, now the average expectancy (or average lifespan of the three) is 50.7 years. But this is just the average age of death of this family of three and does not represent the modal (most common) age of death. This — and this alone — given the very high incidence of death at birth or in childhood as well as the high risk of maternal death in childbirth, historically, drops the average age of death dramatically.
Now, let’s move from hypothetical examples and examine actual worldwide populations, to further understand this.
High Childhood Mortality Results in
Short Life Expectancy for Populations
Regarding the average age of death being 49.3 years in 1900 in the U.S., this is definitely true.[11] And it’s definitely not because most people were dropping dead around the age of 50. Let’s look at why this is.
- In 1800, 43.3% of children, worldwide, did not survive the first five years of life.[12]
- A century later, surviving childhood wasn’t much better. In 1900, 36.2% of children did not survive the first five years of life, worldwide.6
- In the U.S. in 1800, 46.3% of children died before their 5th birthday, and this rate dropped in half by 1900, to 23.2%.6
- Even in France, 22.5% of children born in 1900 did not survive to their 5th birthday, and this number was 15.6% in Sweden that year.6
- Norway had the lowest childhood mortality rate in the year 1900, with 13.4% of children not surviving to their 5th birthday.6
- In that same era (late 19th to early 20th century), around 4% of women, in total, died in childbirth. The risk of death in childbirth was about 1 to 1.5% per birth, with lifetime risk of about 4 percent.[13]
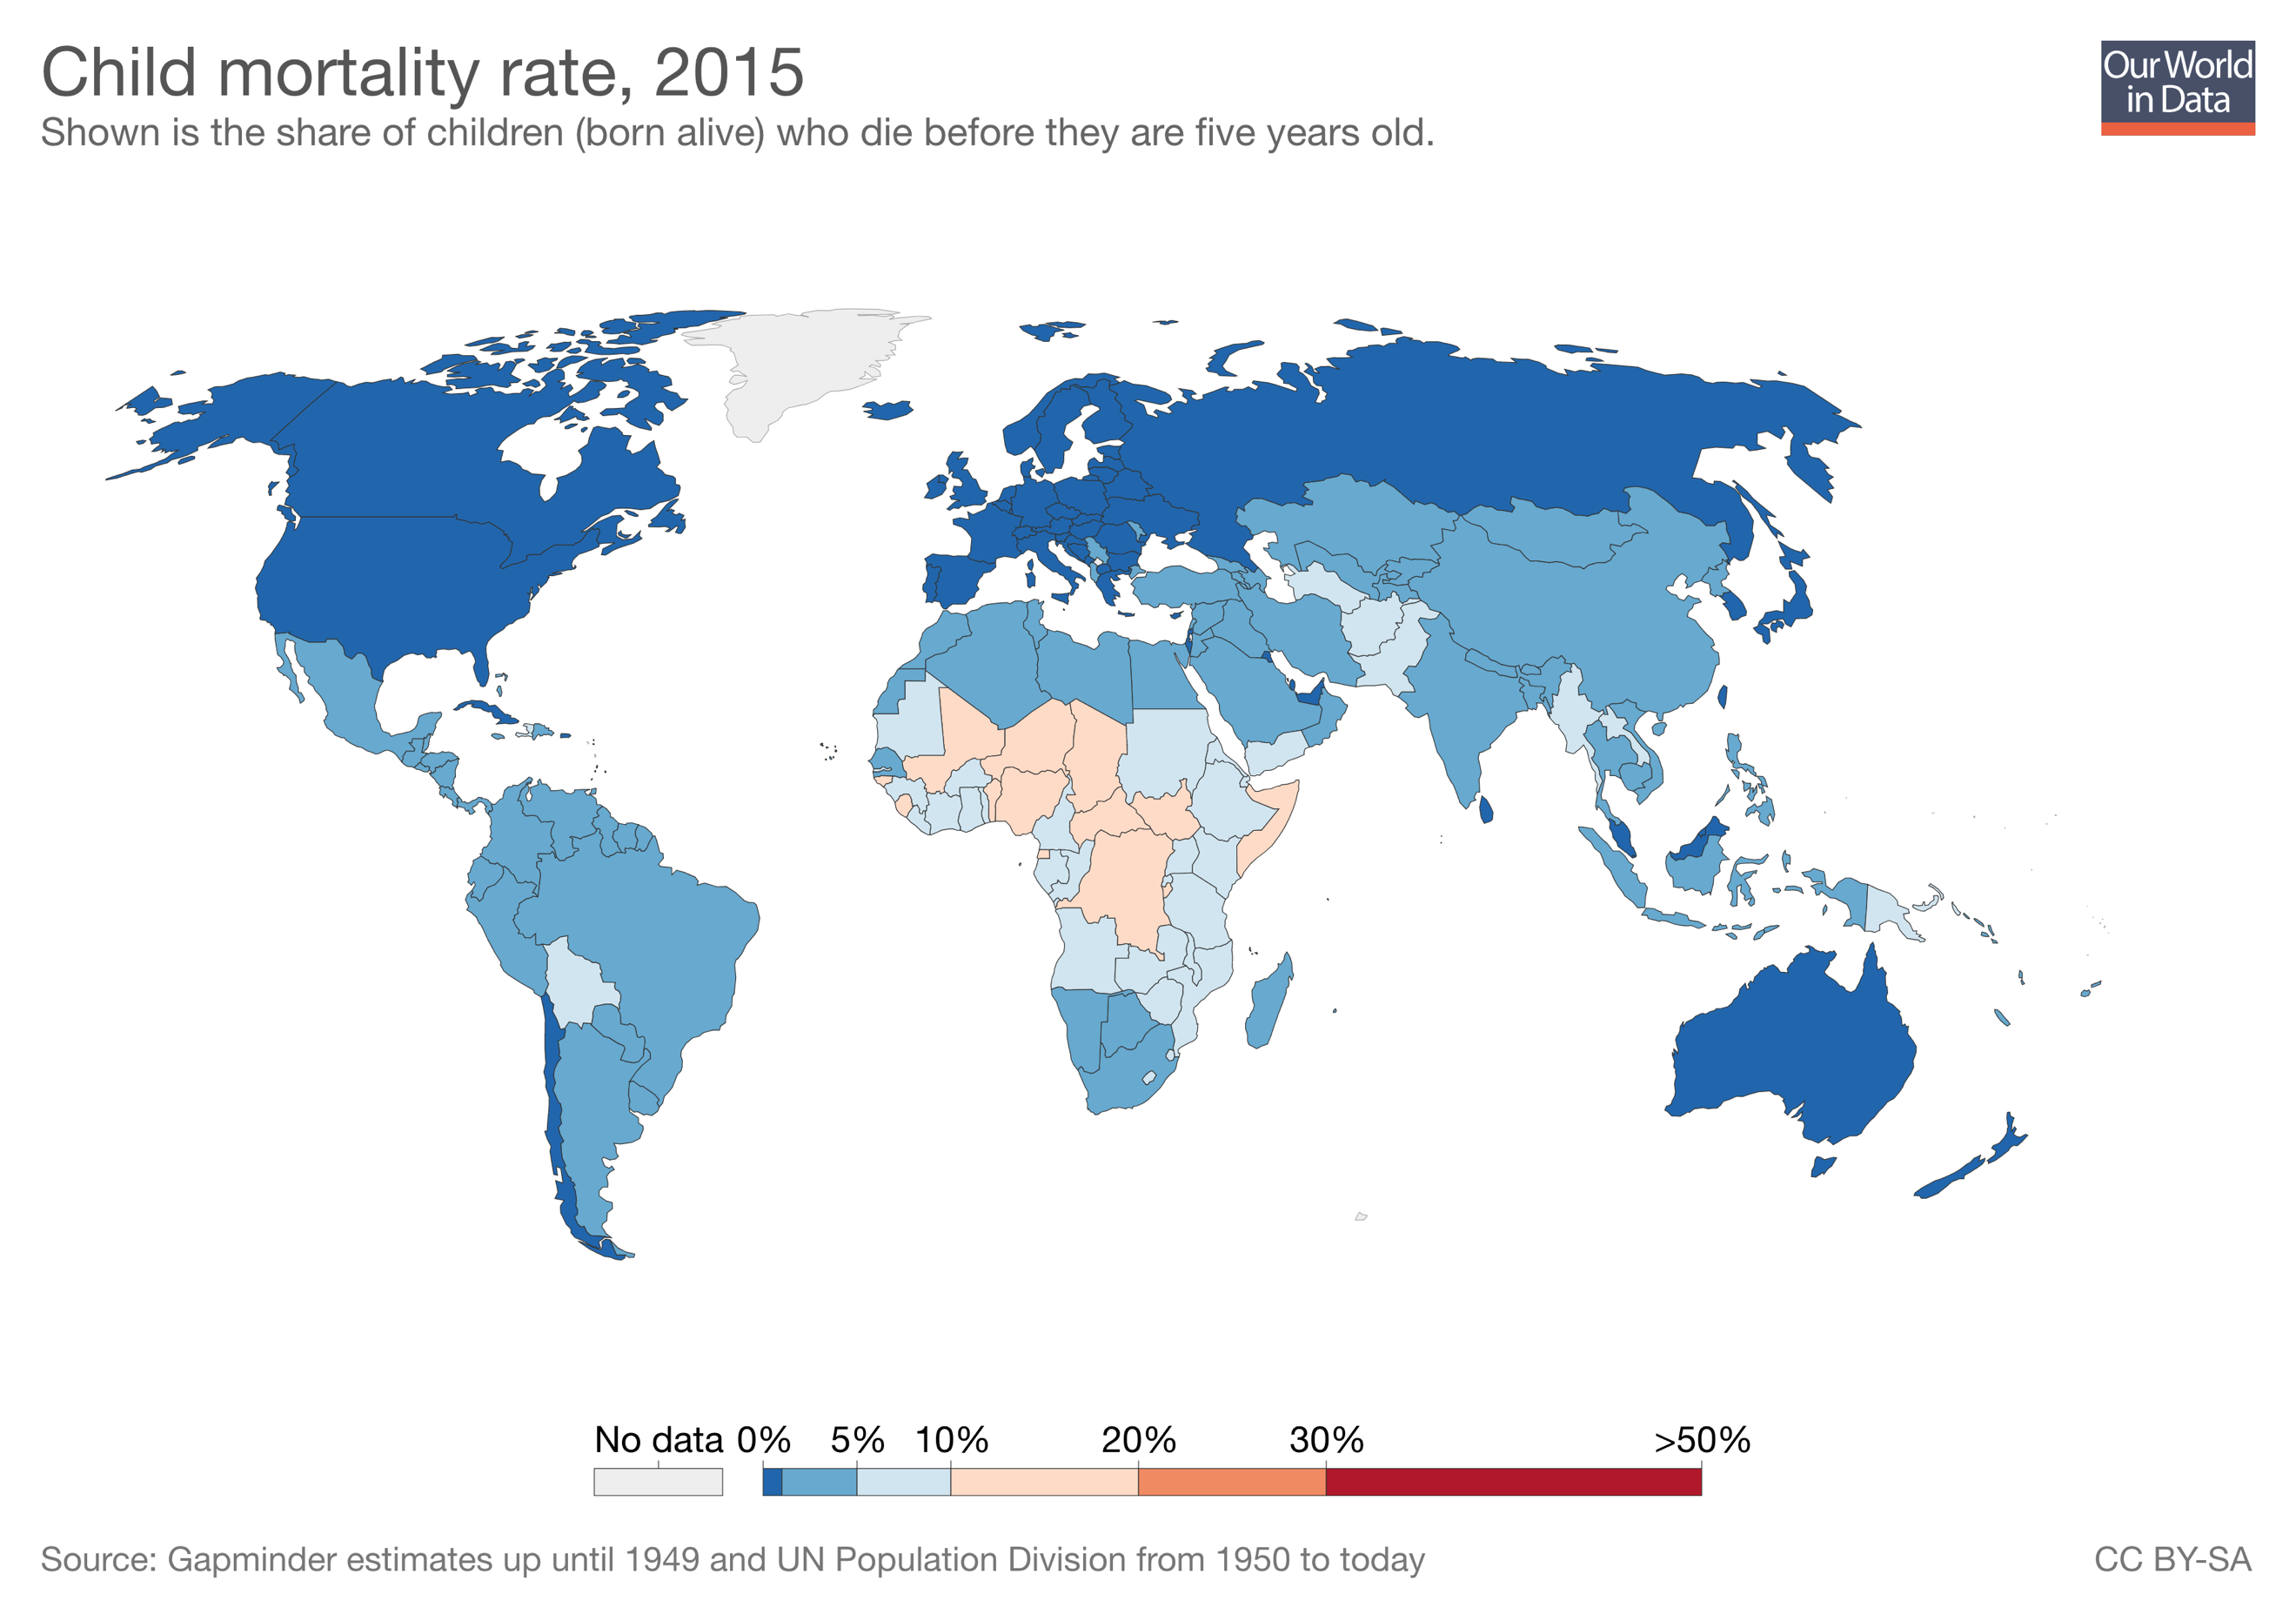
- In 2015, child mortality worldwide was down to 4.3%, which is ten-fold lower than two centuries previous. This, of course, raises the LEB dramatically. This increase in survival of childhood is primarily due to clean water, septic systems, antibiotics, obstetrics and pediatrics.
The graphs below, courtesy of Max Roser, at Our World in Data (www.OurWorldInData.org), show child mortality, which is the percentage of children not surviving to the age of 5 years, by country, worldwide. I’ve selected years 1800, 1850, 1900, 1950, and 2015 for comparison.
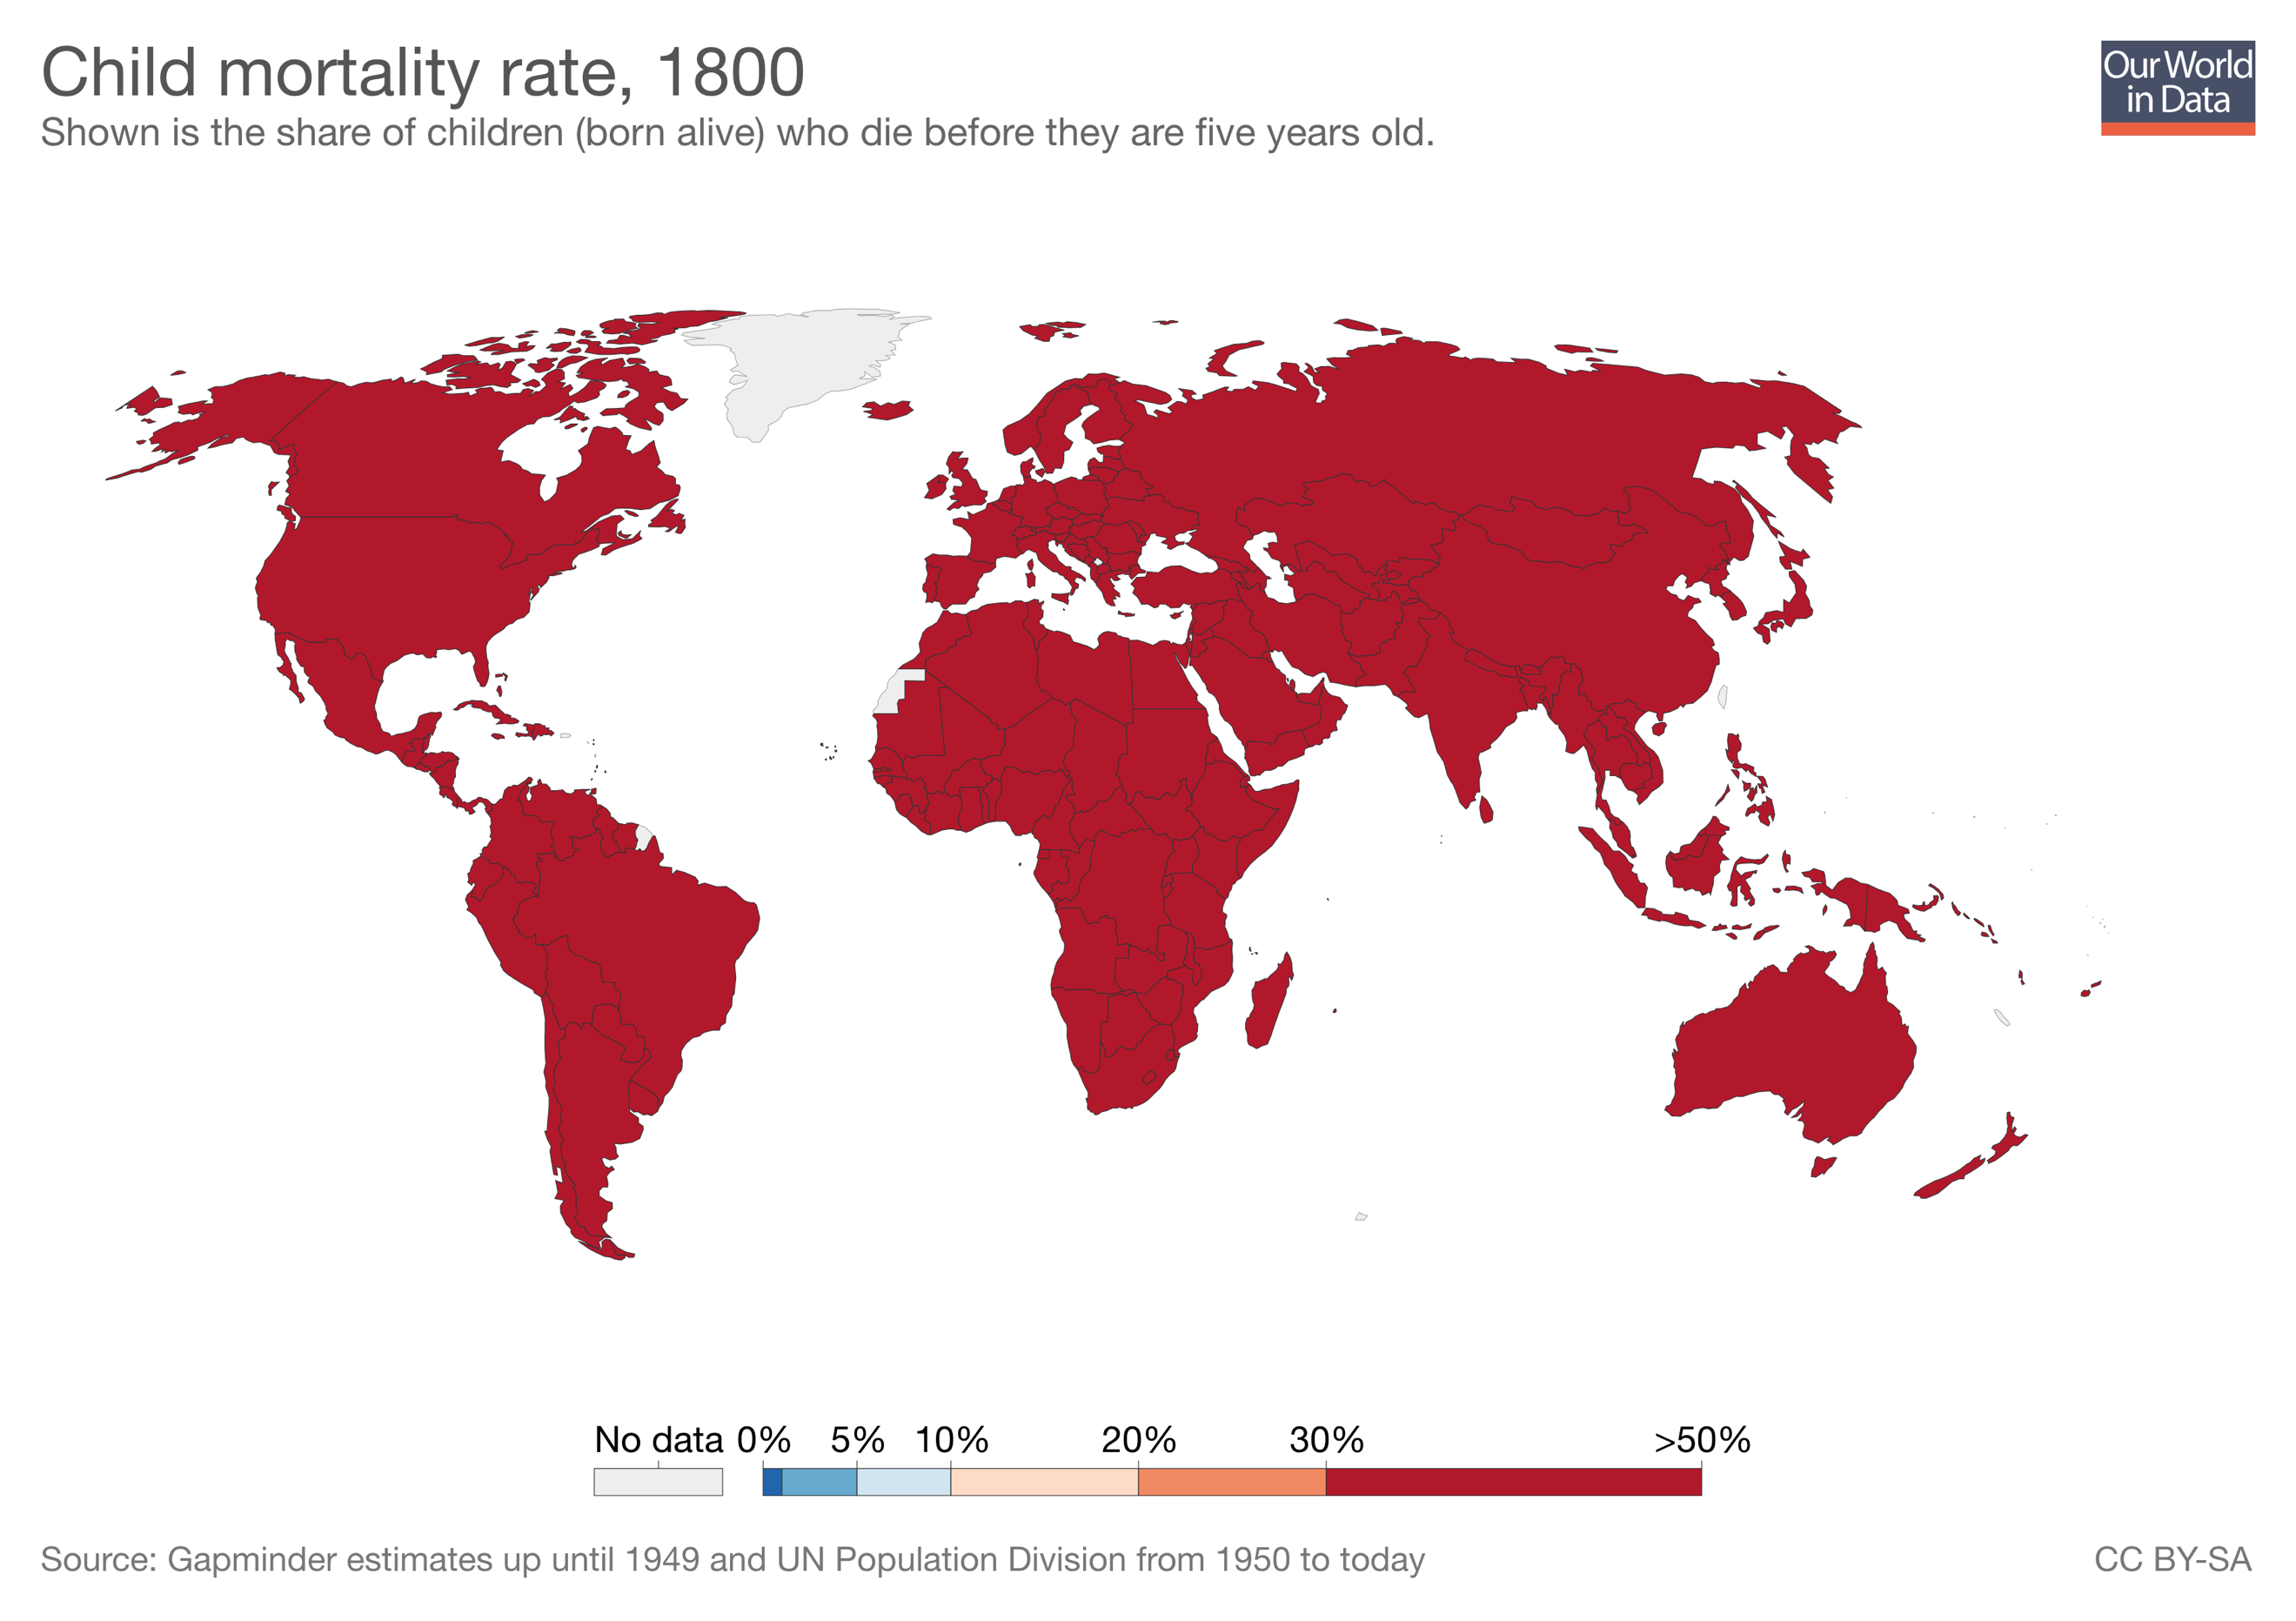
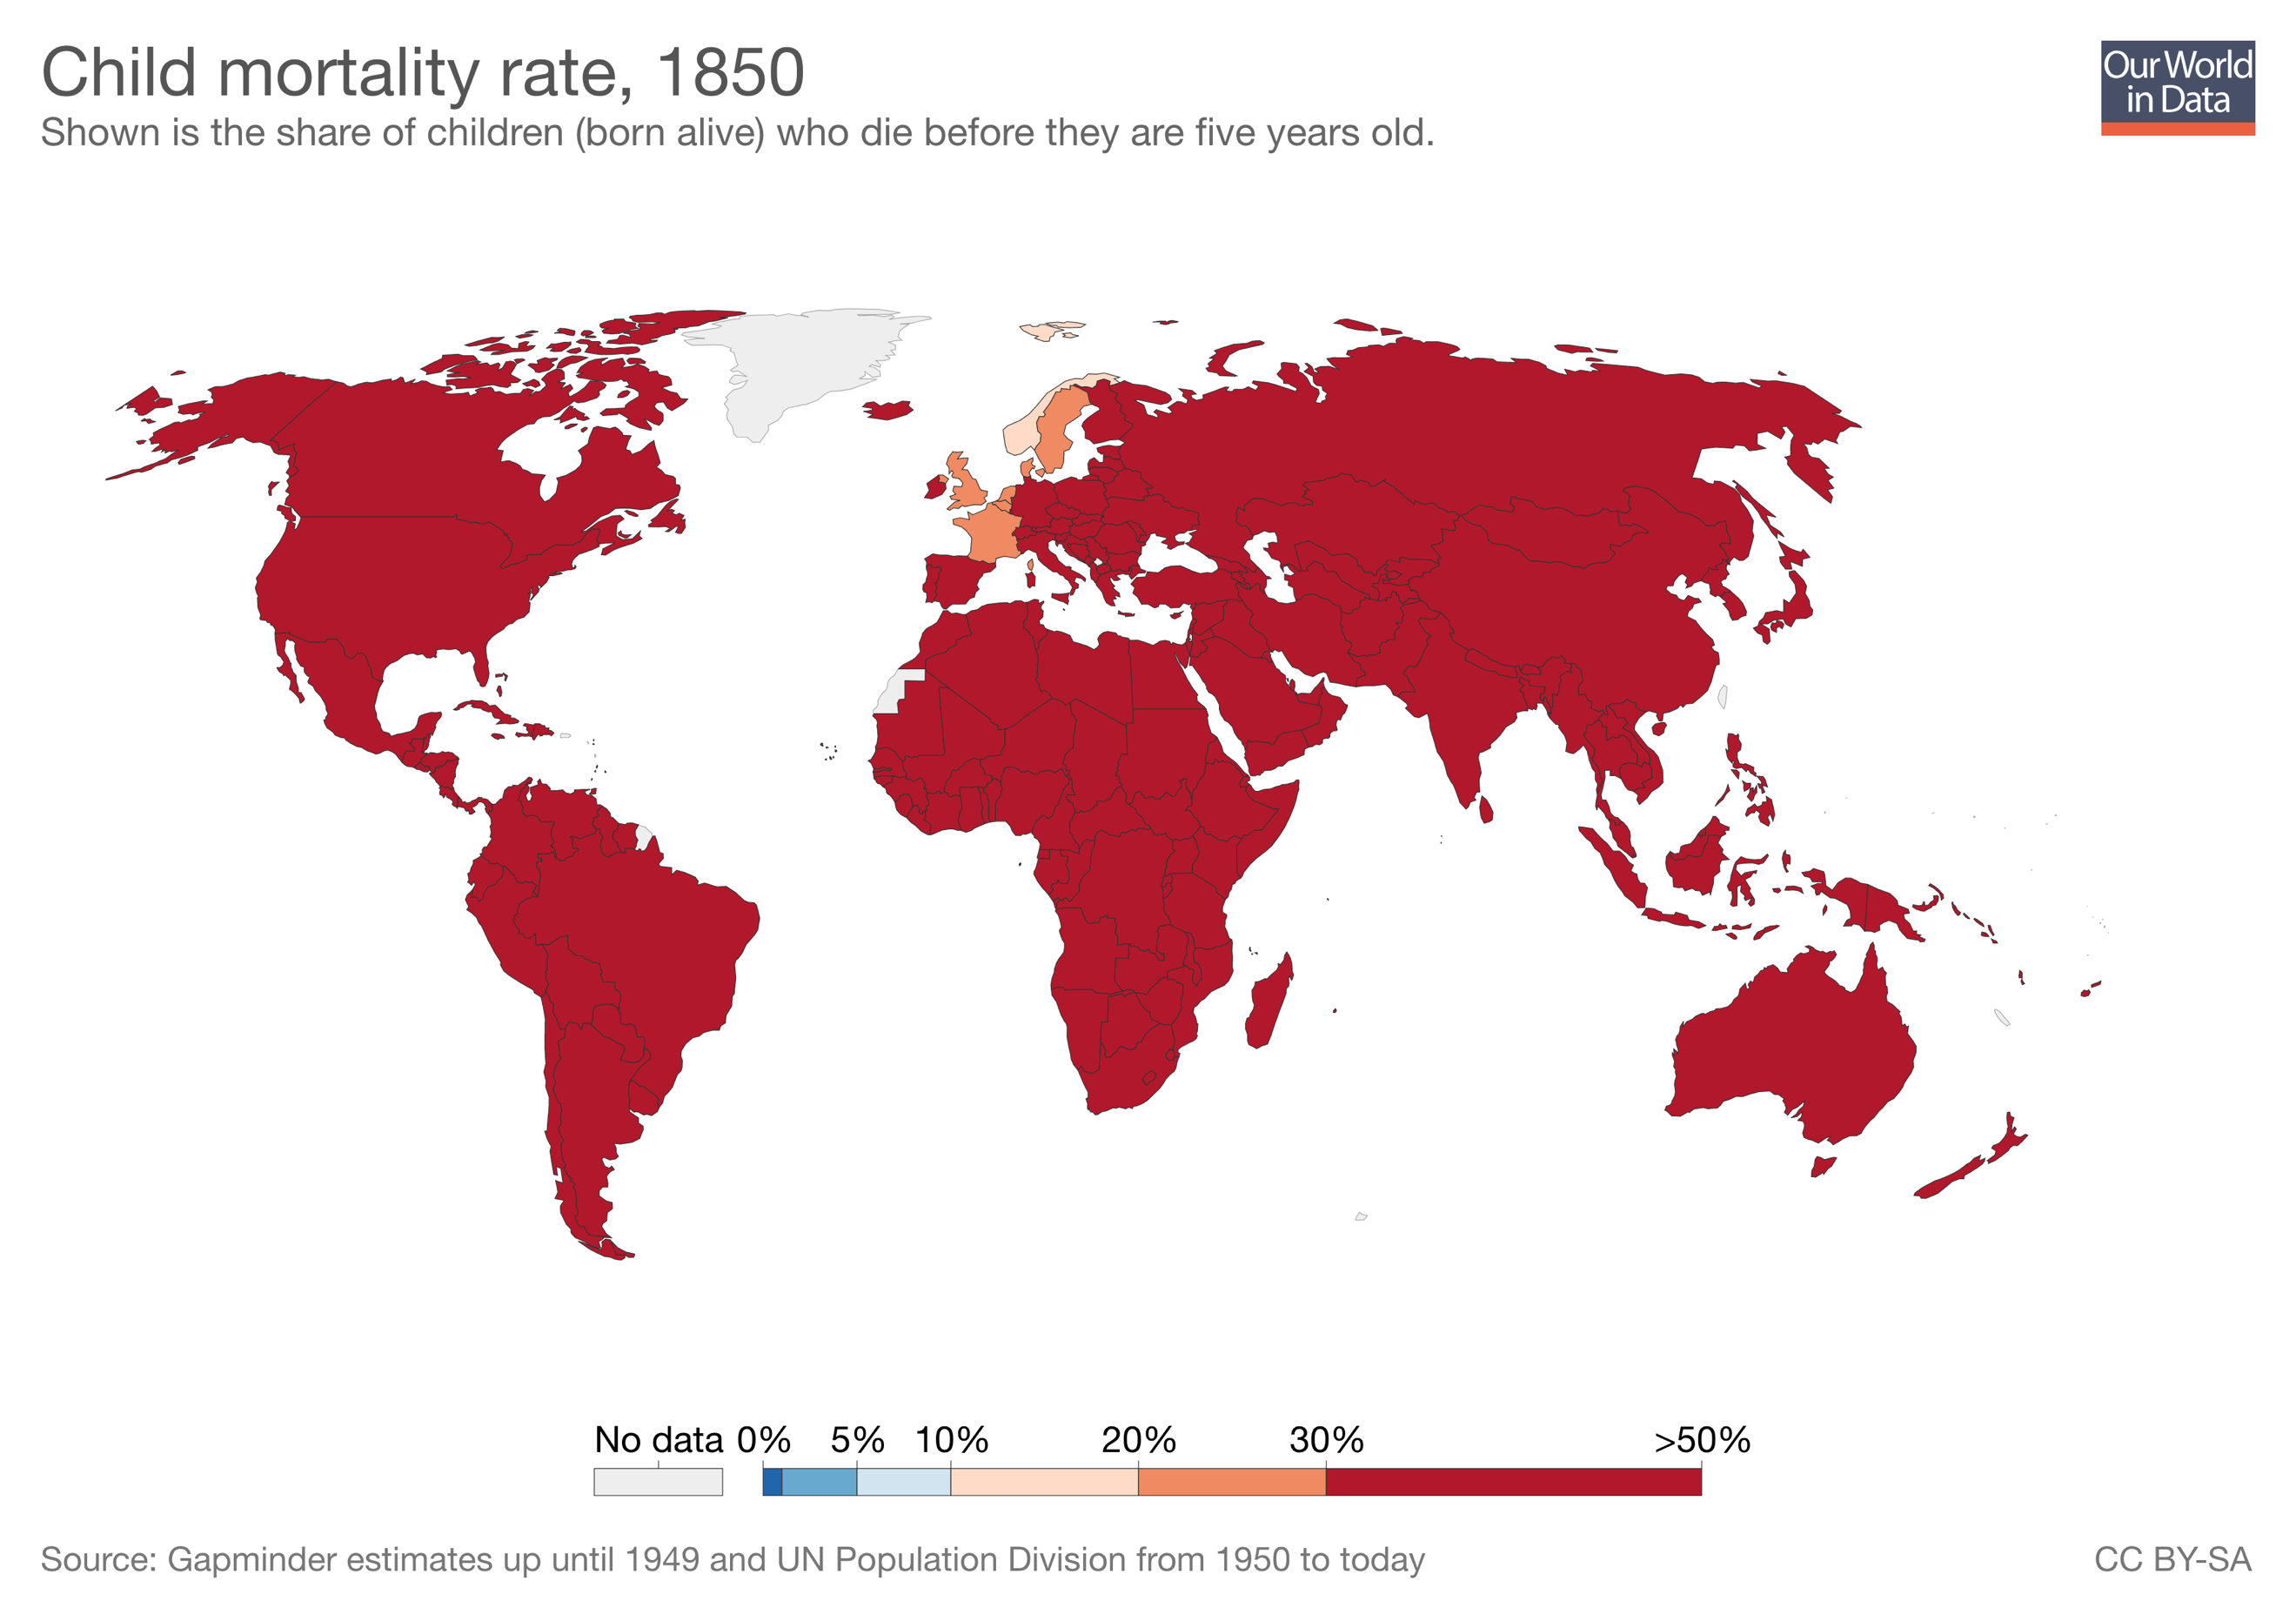
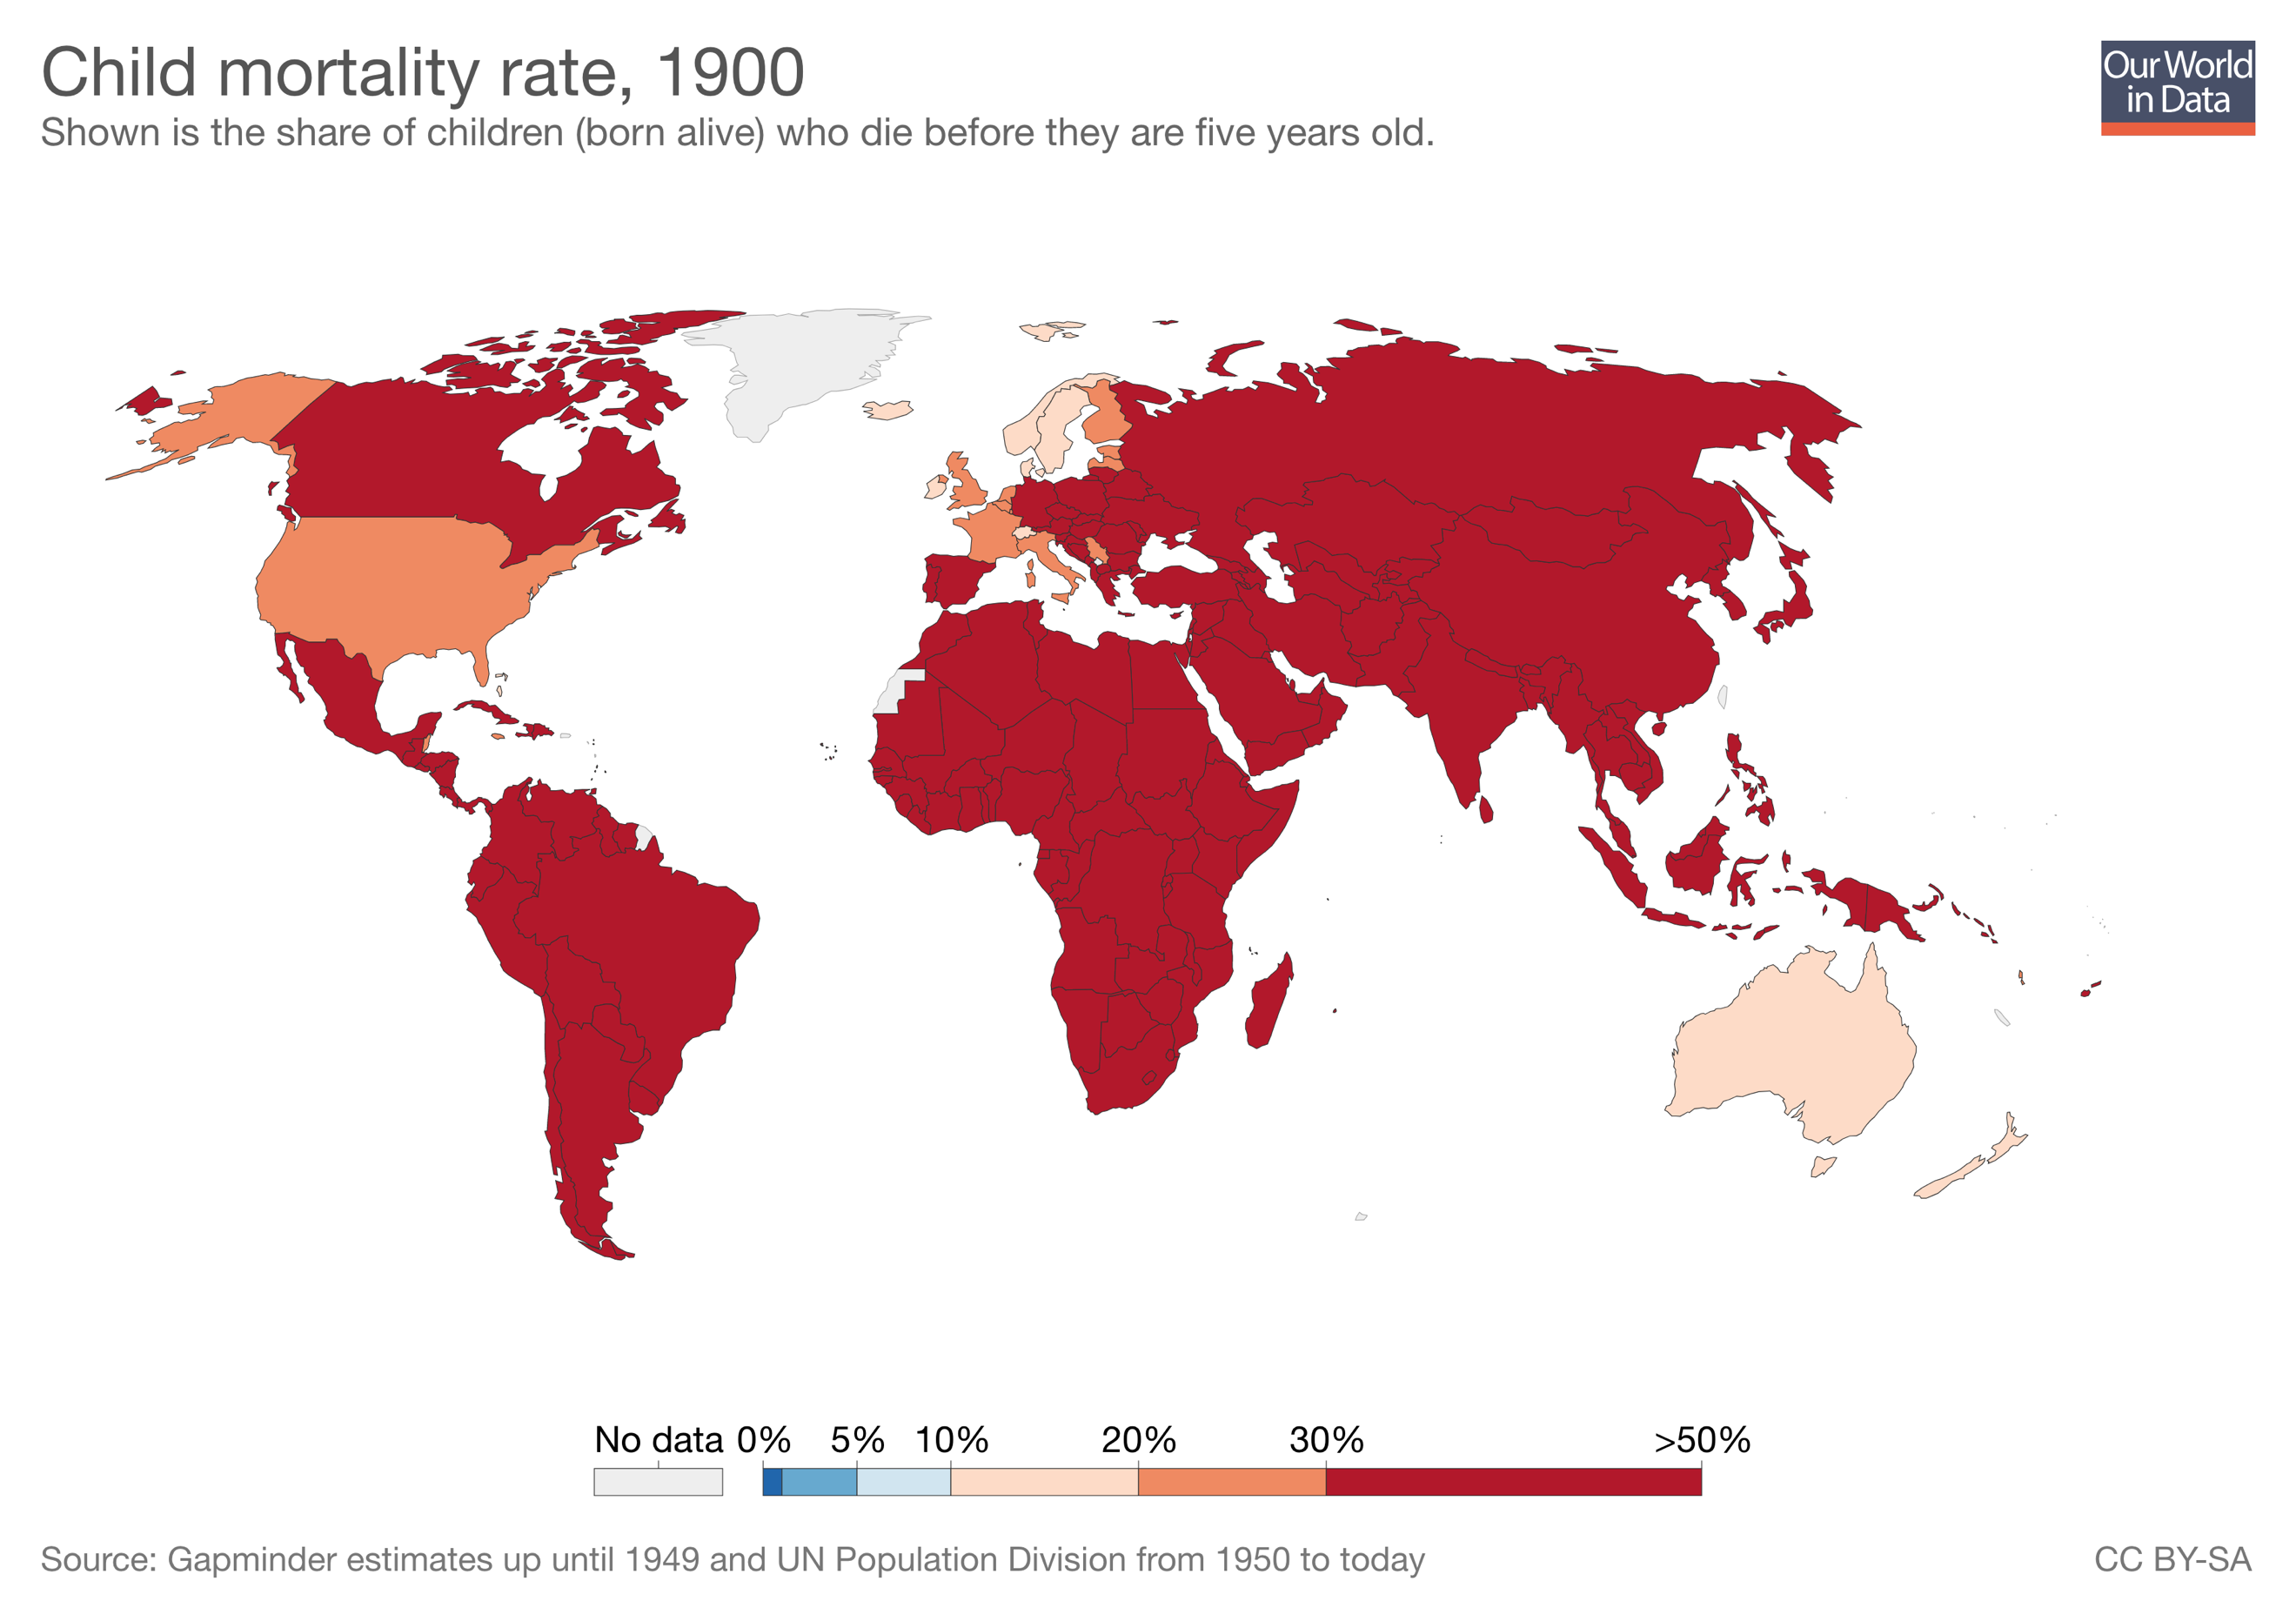
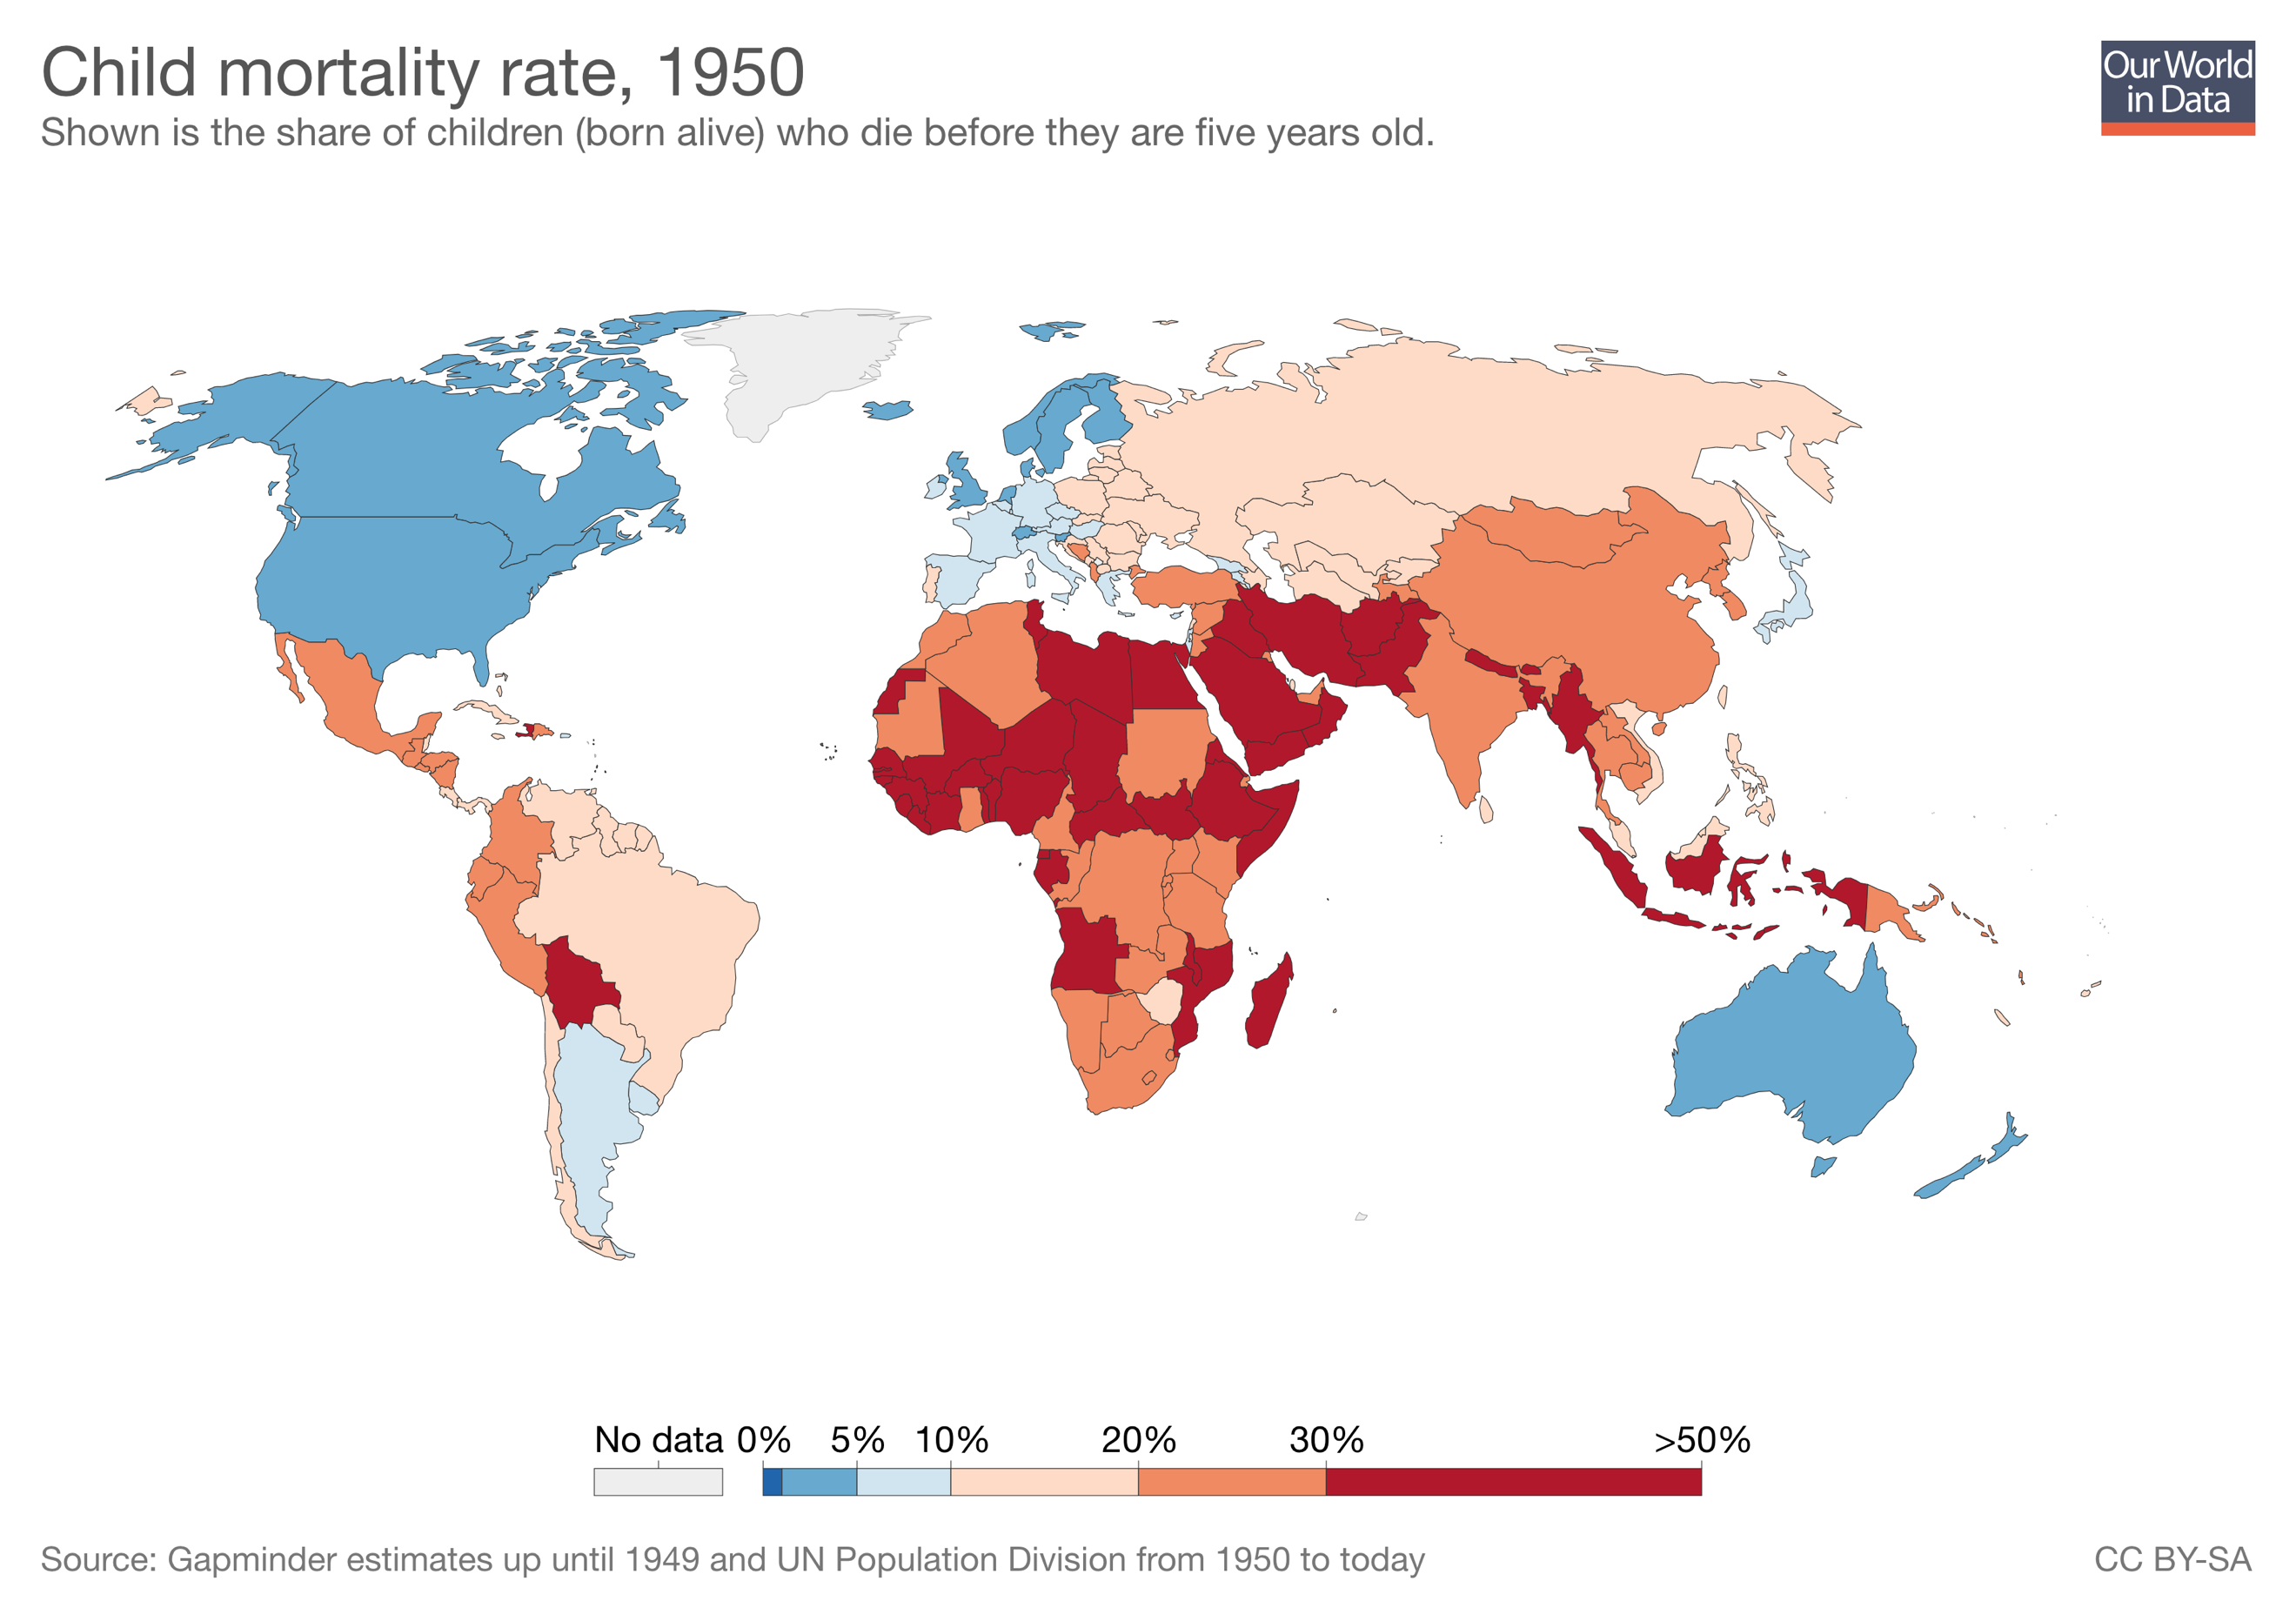
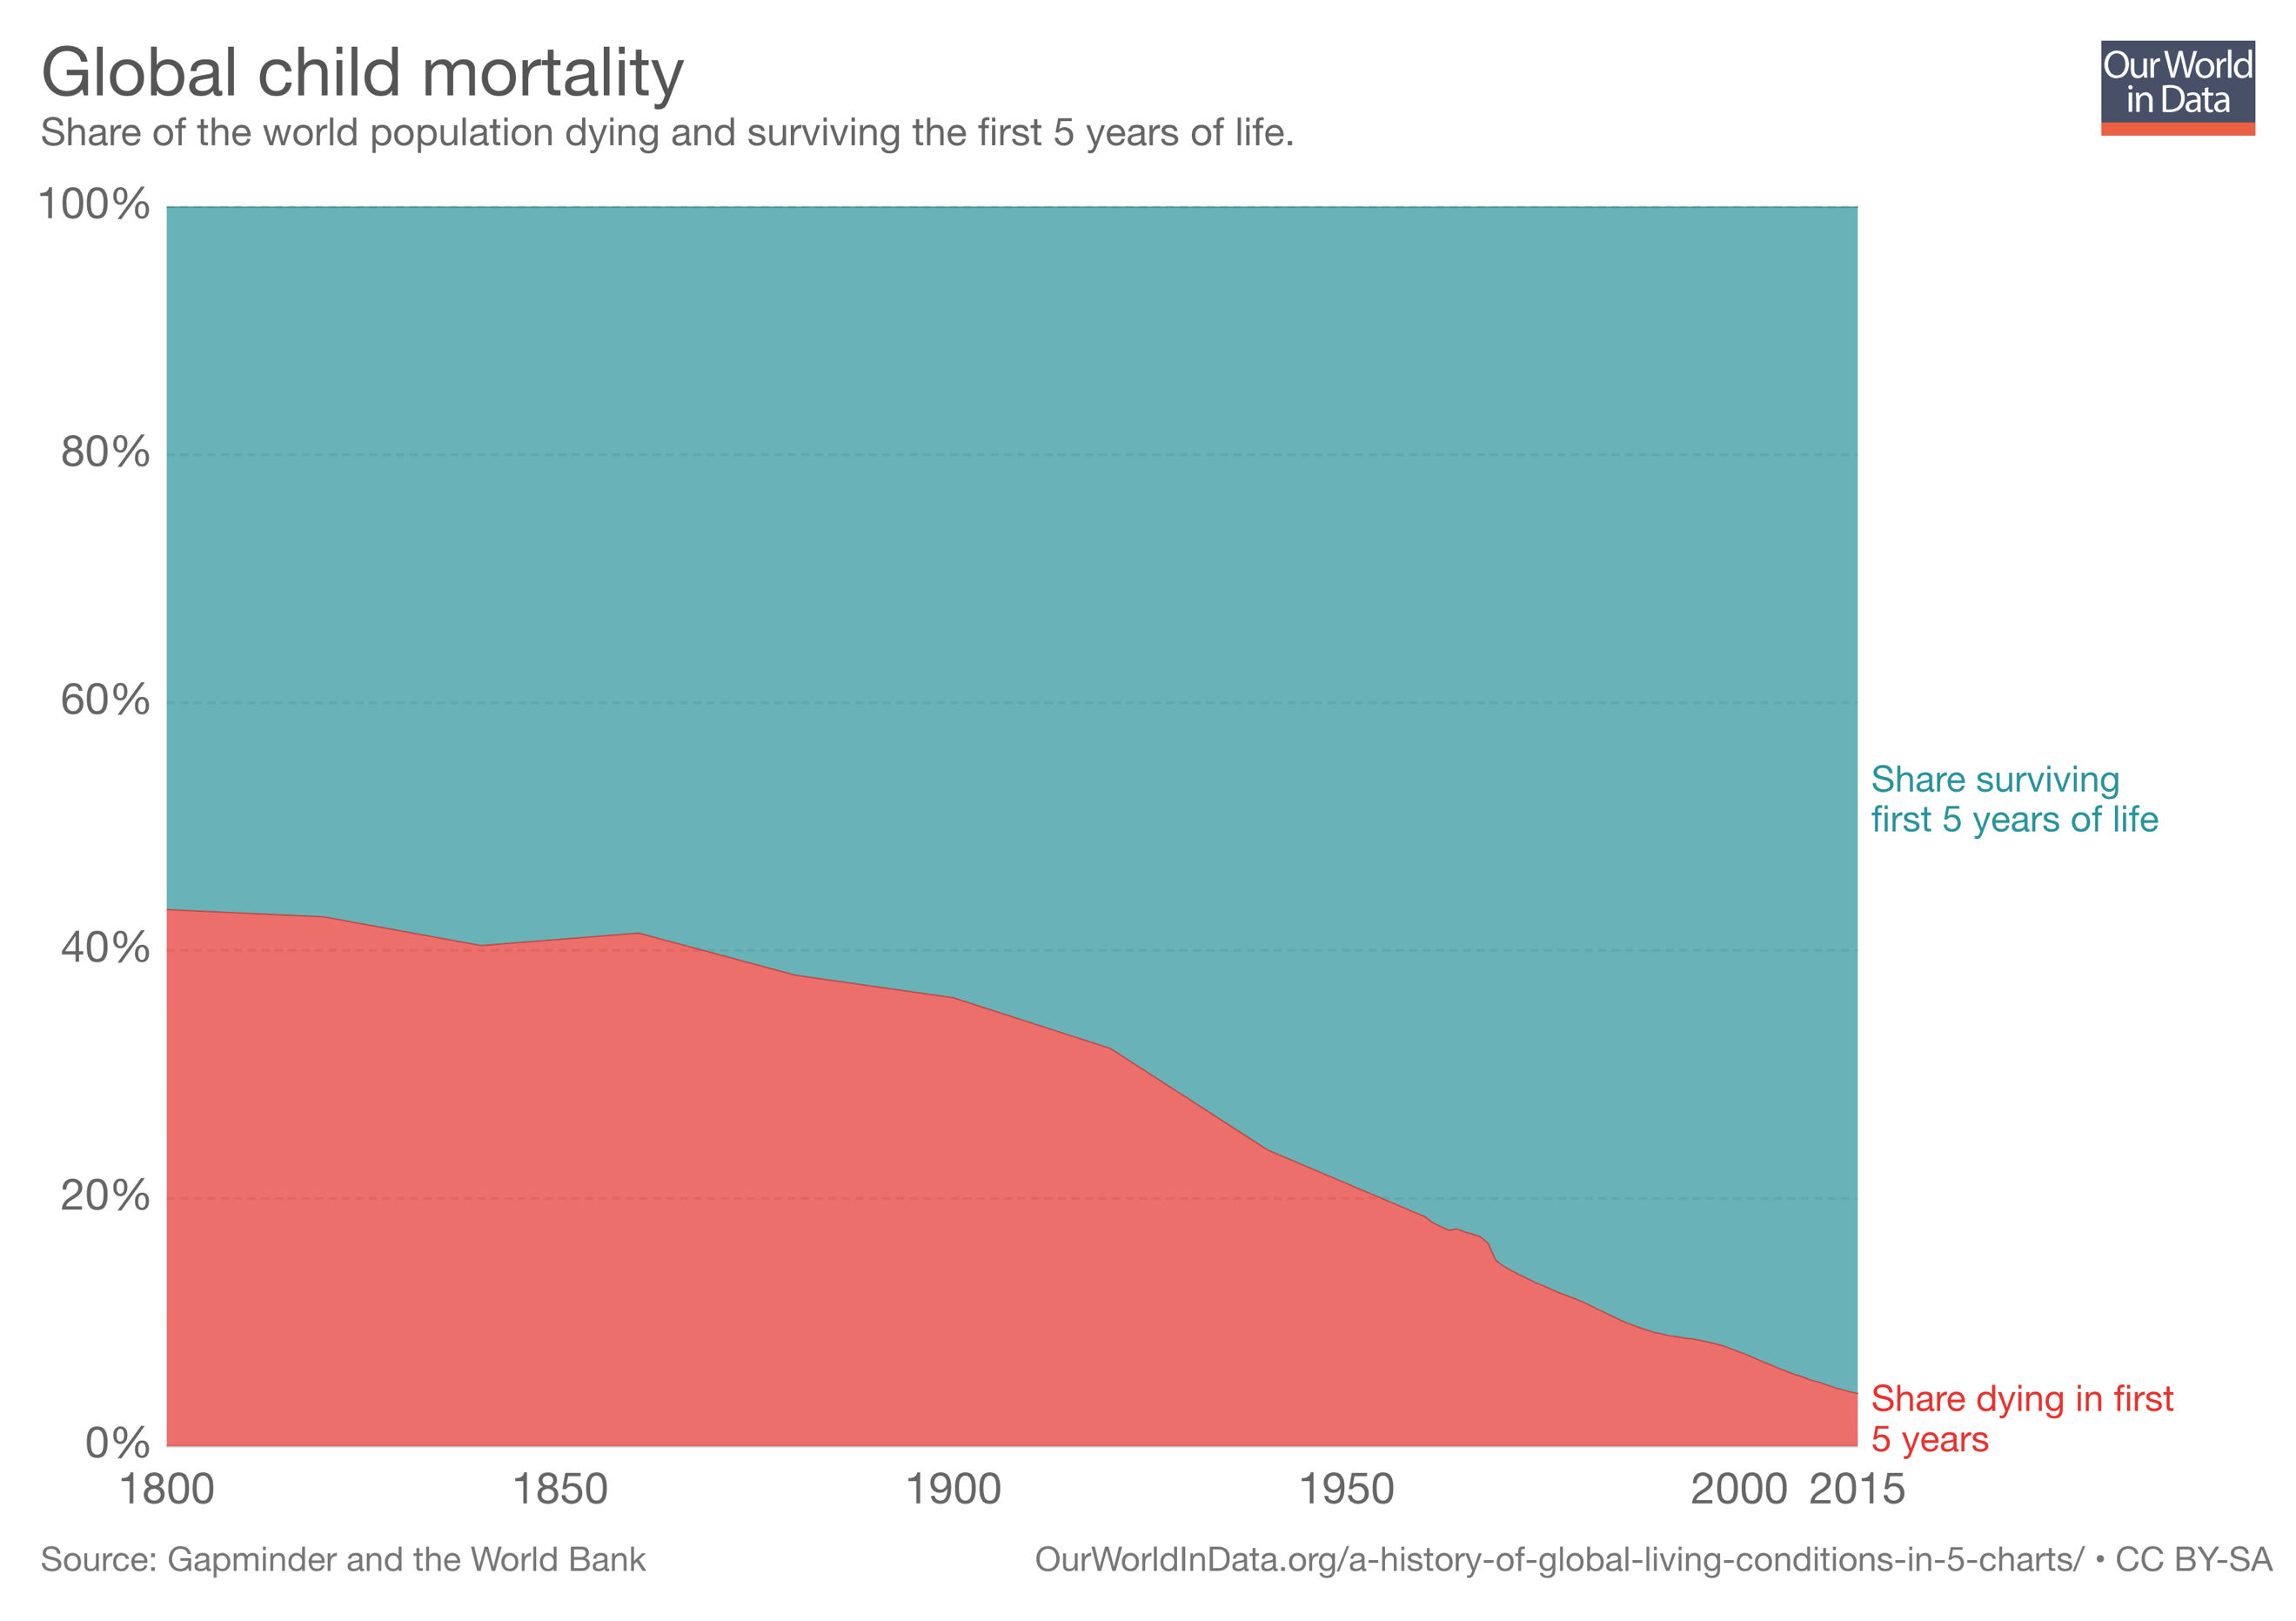
This extraordinary compilation and presentation of data indicates that through much of our history and up until around 1950 and beyond, the average life expectancy was drastically reduced secondary to extreme levels of childhood mortality.
Survival to Elderly Age in England and Wales — 19th to 21st Centuries
But as you’re about to see, for those who survived childhood and some dreaded infectious diseases, living into old age was common; not quite as common as today, but nevertheless, common.
Below, we see a graph prepared, once again, by Max Roser, at Our World in Data, which shows the share of people in England and Wales surviving to various ages and for various years.
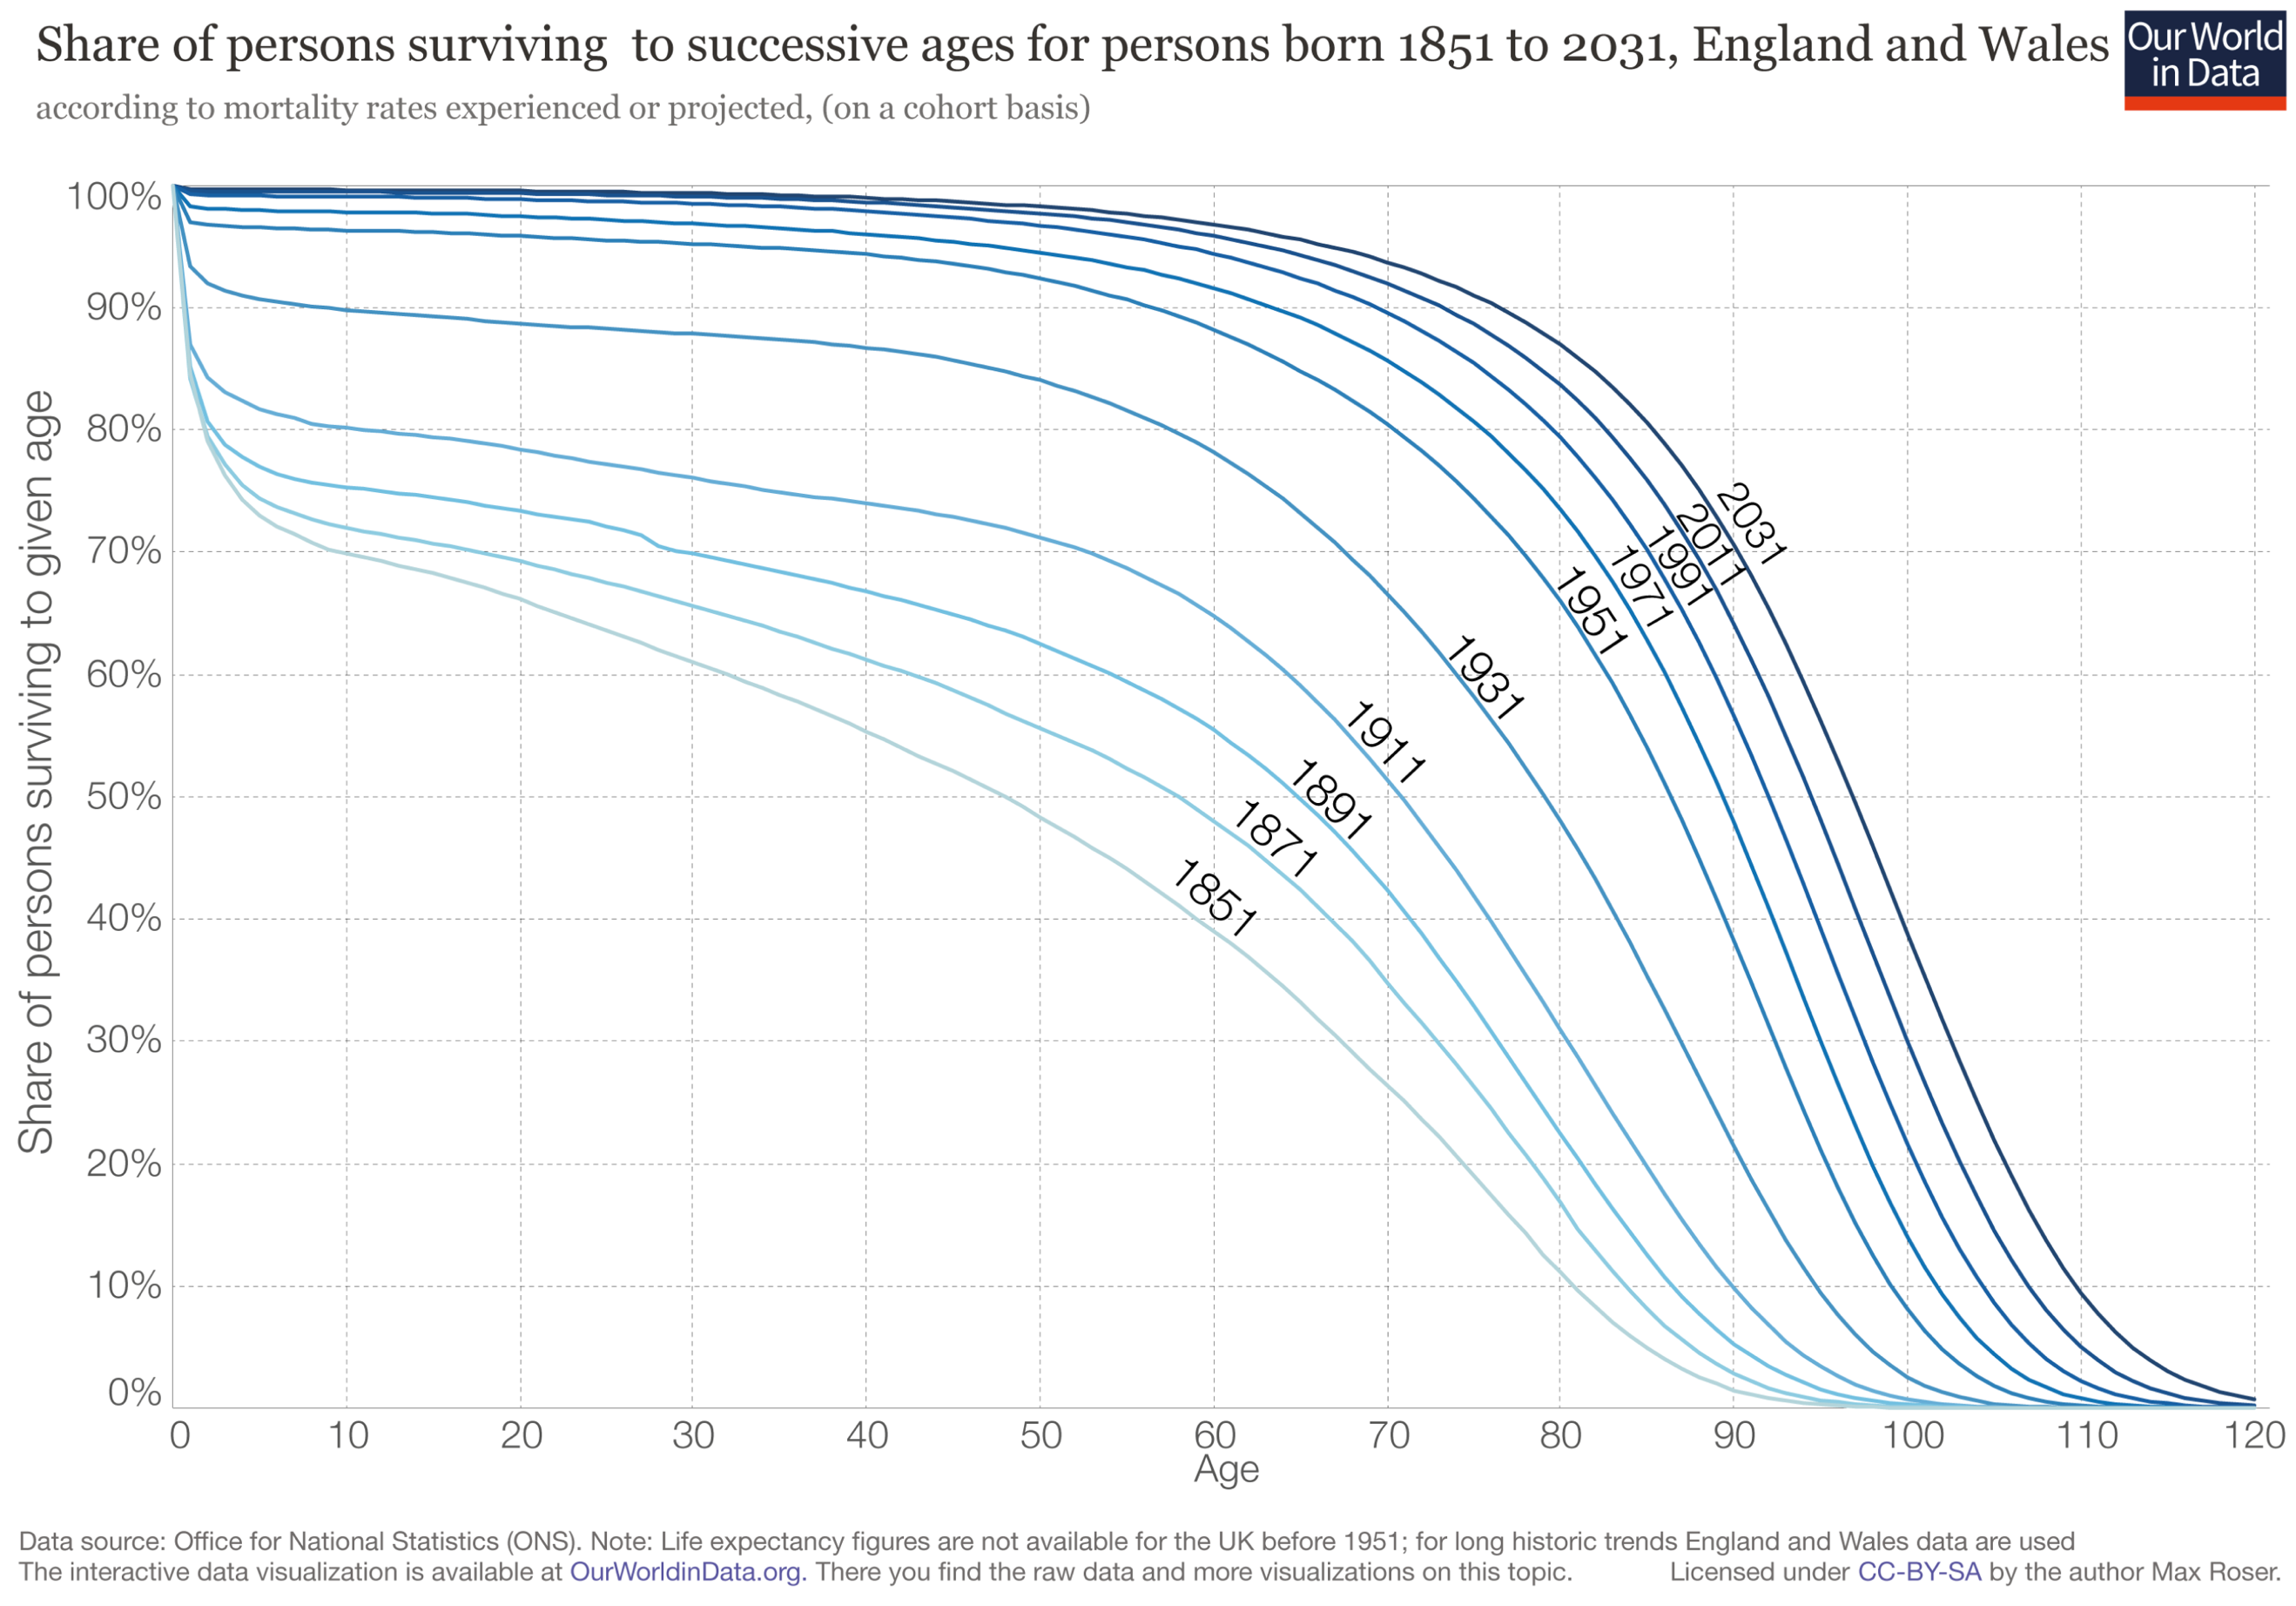
In England and Wales, in the years 1851, 1891, 1911, and 1931, the following table demonstrates the percentages of the population surviving to ages 50, 60, 70, 80, and 90, taken from the Our World in Data graph above.
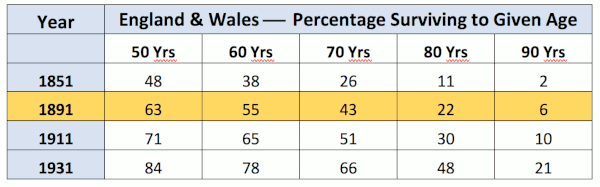
As we can see from the table, even as far back as 1891 (highlighted in the table above), in England and Wales, 55% of the population survived to age 60, 43% to age 70, 22% to age 80, and 6% to age 90.
And in 1911, fully 51% of the population in England and Wales survived to age 70.
In the U.K., in 1900, 23.2% of children did not survive to see their 5th birthday, but more than 43% survived beyond age 70.
So much for people not living long enough to develop AMD in the year 1900, huh?
Life Expectancy for English Aristocracy in the Years 1200 — 1745
Genealogical records for noble families of Europe are maintained very accurately and sufficient numbers of nobility existed to make accurate calculations with minimal sampling errors, according to the research of H.O. Lancaster.[14] Omitting those that died due to accidents, violence, poison, or in battle, the table below shows life expectancy for males who survived to age 21, along with the associated period of time, and the number of males observed for that period.
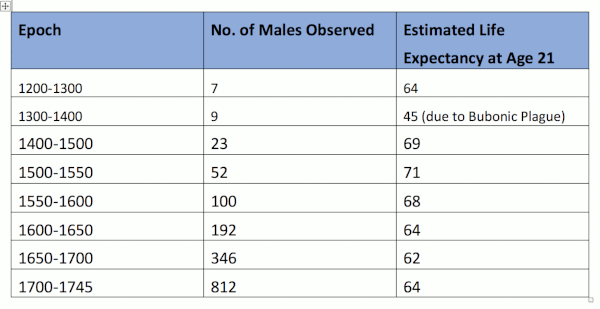
Notably, for royal families, as far back as 1200 to 1745, we see that life expectancy, for those who survived to age 21, ranged from a low of 62 to a high of 71. Furthermore, because this is an arithmetic mean, that means that from 1500 to 1550 when the estimated life expectancy was 71, for example, likely just as many men died before age 60, as after age 80.
Multiple different sources confirm similar findings for life expectancy of scholars in the Medieval Islamic world, which ranged from 59 to 84.3 years. [15] [16] [17] [18]
In any case, as far back as the 13th century, populations were surviving into their 60s, 70’s, and 80’s, without question. Undoubtedly, there’s never been a time in history when people didn’t survive long enough to develop macular degeneration, that is, beyond age 50.
Twenty Five Percent of Inuit, between 1822 1836,
Survive Beyond Age 60
Nutrition researcher, neuroscientist, and obesity researcher, Stephan Guyenet, PhD, formerly of the University of Washington, addressed this issue in an article entitled, “Mortality and Lifespan of the Inuit,” wherein he wrote,
“One of the classic counter-arguments that’s used to discredit accounts of healthy hunter-gatherers is the fallacy that they were short-lived, and thus did not have time to develop diseases of old age like cancer. While the life expectancy of hunter-gatherers was not as high as ours today, most groups had a significant number of elderly individuals, who sometimes lived to 80 years and beyond. Mortality came mostly from accidents, warfare and infectious disease rather than chronic disease.”[19]
He found a “mortality table from the records of a Russian mission in Alaska, which recorded the ages of death of a traditionally living Inuit population during the years 1822 to 1836.” Note that, as Guyenet asserts, “Excluding infant mortality, about 25% of their population lived past 60.” He estimates that Westerners had a similar life expectancy at that time.
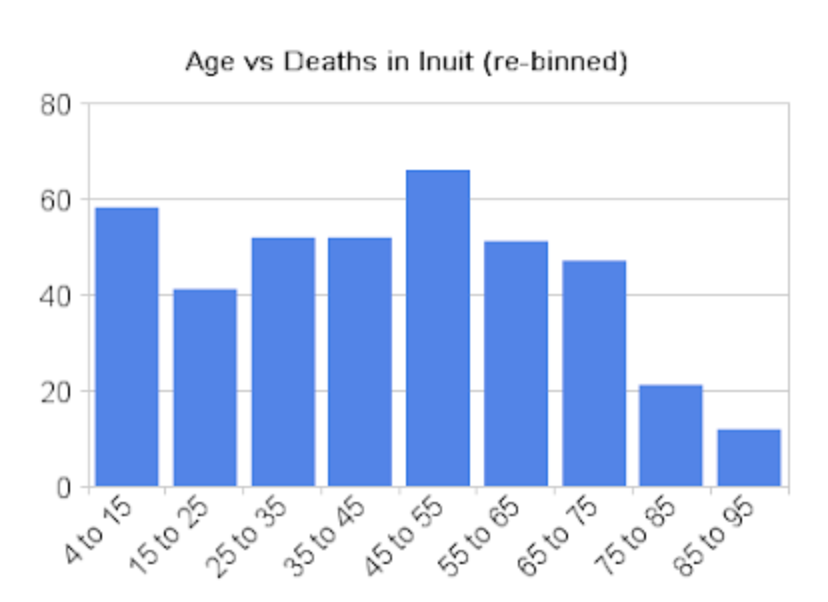
Deaths Per 1,170 Inuit, Years 1822 – 1836. The bins represent the number of deaths per each age category, out of the total population, along the Y-axis (vertical), with the age brackets at death along the X-axis (horizontal).
As we can see from the table prepared by Dr. Guyenet, the maximum lifespan of the Inuit, as shown here between the years 1822 and 1836, is basically the same as Americans today, i.e., around 100. The average life expectancy is lower, but once again is due primarily to high childhood mortality.
Most Common Age of Death for Hunter-Gatherers is 72

Researchers Michael Gurven and Hillard Kaplan, in a paper published in Population and Development Review, entitled “Longevity Among Hunter-Gatherers: A Cross-Cultural Examination,” analyzed “mortality profiles obtained from small-scale hunter-gatherer and horticultural populations from around the world,” and determined that the typical “adaptive” lifespan of our evolutionary Homo sapiens ancestors was 68 to 78 years. They determined that the modal (most common) age of death for hunter-gatherers who survived past the age of 15 years, was 72.[20]
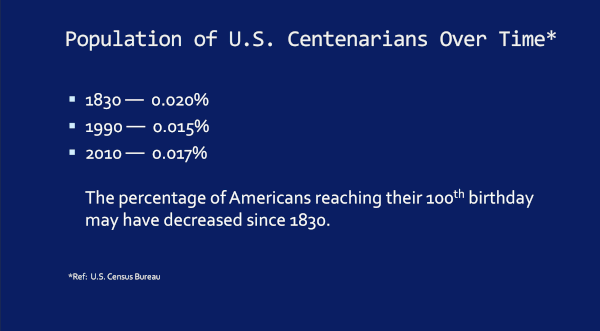
Lower Likelihood of Reaching Age 100 Today, than in 1830
This is data from our own U.S. Census Bureau regarding the likelihood of reaching age 100 years, by any given year. Notice that the likelihood of reaching age 100 today is lower today, than it was in 1830. It appears that fewer people, on a per capita basis, reach the centenarian mark today, than they did nearly two hundred years ago.
A Few Real Life Examples
Now finally, just for your perusal, let’s take a look at some other interesting real life examples associated with this whole subject.
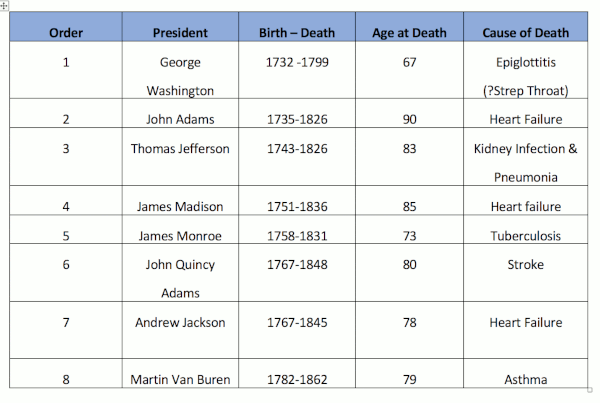
The First Eight U.S. Presidents Age and Cause of Death
Just the first eight U.S. presidents average age at death was 79.4 years (average age of men’s death today, in the U.S. is 76) and the last of these eight to die was Martin Van Buren, in 1862.[21] [22]
Prominent Figures in 19th Century Ophthalmology History
And perhaps for our ophthalmologist, optometrist, and vision scientist readers, If we look at the 19th century’s greatest contributors to the specialty of ophthalmology…
- Herman von Helmholtz, inventor of the ophthalmoscope, which made the retina (and the macula) visible, died at age 73 (1821 – 1894)
- Jonathan Hutchinson, first Ophthalmologist to describe macular degeneration, died at age 84 (1828 – 1913)
- Hermann Pagenstecher, who advanced intracapsular cataract surgery, died at age 88 (1844 – 1932)
- Otto Haab, who presented a critical paper in 1895, which confirmed the rarity of macular degeneration in Germany, died at age 81 (1850 – 1931)
- Ernst Fuchs, author of a famous textbook of ophthalmology in 1892, died at age 79 (1851 – 1930)
- Julius Hirschberg, famous for his textbook of ophthalmology as well as the Hirschberg test for assessing eye alignment, died at age 81 (1843 – 1925)
Abraham Lincoln and Family: Ages at Death & Causes of Death
Next, let’s take a look at the family of an American icon and our 16th U.S. president Abraham Lincoln.
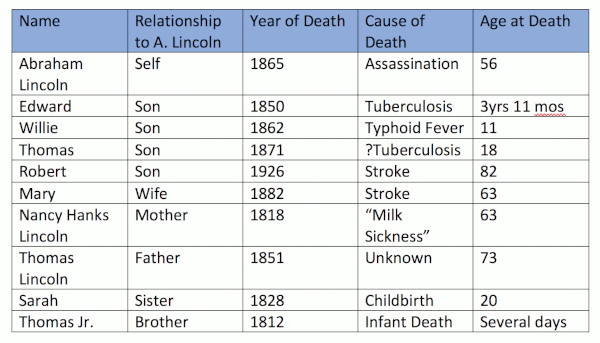
The examples in this famous 19th century family, represent the reasons why the average life expectancy was so low in the 19th century and prior. And again, it’s not because people didn’t live to be elderly, but rather, because many died in childhood, mostly due to infectious diseases.As we can see, Abraham Lincoln, who might well represent a rather typical family in the 19th century, lost three of his sons, all by 18 years of age Edward at age 3 due to Tuberculosis, Willie at age 11 secondary to typhoid fever, and Thomas at age 18, perhaps due to Tuberculosis or a heart condition. Abraham’s brother died in infancy at just a few days old, and his sister died in childbirth, at age 20. Robert, his only son to survive childhood, lived to the age of 82.
Quite frankly, in almost any review of history, one will find men and women living into their 7th, 8th, and 9th decades, and beyond. It’s no different than today, in terms of maximum lifespan. Even the famous Greek physician, Hippocrates, is thought to have lived from 460 BCE to 370 BCE, a period of 90 years.[23]
Even the Bible references this; the King James Version (KJV) Psalms 90:10 reads, “The days of our years are threescore years and ten; and if by reason of strength they be fourscore years, yet is their strength labour and sorrow; for it soon cut off, and we fly away.”
And the KJV Genesis 6:3 reads, “And the Lord said, My spirit shall not always strive with man, for that he also is flesh: yet his days shall be an hundred and twenty years.”
It’s rather provocative that the Bible states man’s life is 70 to 80 years, or perhaps a maximum lifespan of 120 years, correct? More than 2,000 years later, this is still what we see.
Let me conclude by repeating the only section in my book where I assumed I had answered the question about life expectancy around 1900 and AMD prevalence, as I mistakenly concluded that this – and this alone – would satisfy the concern that ‘we just didn’t live long enough to get AMD.’
1920 Nearly 5 Million People Over 65, Yet Virtually No AMD
“In 1920, the U.S. Census Bureau shows that there were 4.93 million people over the age of 65, as compared to 35 million over 65 by year 2000. As we’ve witnessed, there were almost no reports of AMD in any U.S. literature. Jumping ahead a bit, by 1990, Professor Ron Klein, MD, and colleagues, found that, “In persons 43 to 86 years of age, the overall prevalence of any ARM [age related maculopathy, translates to dry AMD], was 20.9% and of late ARM it was 1.9%.” If the same prevalence rates existed in 1920, even if only considering the population over age 65 in the U.S., there should have been over 1.1 million people affected with AMD. The literature and textbooks would have literally been flooded with studies or reports on macular degeneration, yet there was near complete silence on the subject.” [24]
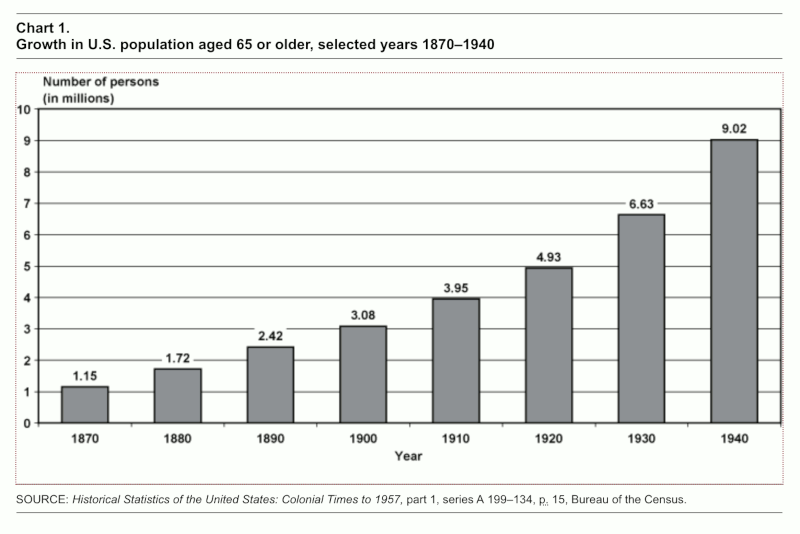
As I state in my live presentations, if the prevalence of AMD in 1920 was the same as 1990 (22.8% total), which it should be if AMD is primarily a disease of aging and genetics, as is currently believed by conventional ophthalmology, then there should have been at least 1.1 million people with AMD in 1920 if we only consider those over the age of 65.
Yet, in 1920, AMD was still an extreme medical rarity.
Summary
Age-related macular degeneration, or AMD, is confirmed to be a medical rarity, from 1851 to 1930, worldwide. By 1920, despite the fact that more than 200 different brands and versions of ophthalmoscopes were in use, no more than about 50 cases of AMD existed in all the world’s literature.
Processed food consumption primarily began in 1880, with the introduction of refined white wheat flour and polyunsaturated vegetable oils that year, and with artificially created trans fats having been produced and introduced to the market by Proctor & Gamble, in the form of Crisco. Sugar consumption was on the rise.
These four foods gradually supplanted and replaced traditional foods of our ancestors, such as meats, organ meats (e.g., liver, giblets, heart, pancreas, etc.), fowl, fish, eggs, fruits, vegetables, whole grains, nuts and seeds, such that by 2009, 63% of the American diet was made up of these such foods.1 What followed was an insidious and inexorable progression of chronic metabolic and degenerative diseases, in the form of heart disease, stroke, cancers, type 2 diabetes, hypertension, Alzheimer’s disease, dementia, autoimmune disorders, etc., and age-related macular degeneration (AMD).
Detractors of the hypothesis which holds that AMD is a disease of processed food consumption, primarily assert one thing: ‘We didn’t live long enough, back before 1920, to have as much AMD as we have today.’
In this analysis and review, we’ve shown that to be yet another inchoate and erroneous belief system, that is neither correct, nor logical.
The study of life expectancy in England and Wales shows that, even in the late 19th century, in 1891, 55% of the population survived to age 60, 43% to age 70, 22% to age 80, and 6% to age 90.
And in 1911, 51% of the population in England and Wales survived to age 70.
England and Wales are quite typical of developed nations, and we should expect much of the developed world was the same.
And as Stephan Guyenet showed, between the years 1822 and 1836, around 25% of an Inuit population survived beyond age 60, if infant mortality was excluded.
I believe we can draw clear conclusions from this analysis millions of people all around the globe, lived long enough in the 19th and early 20th centuries, to develop macular degeneration (AMD). That is, substantial percentages survived well beyond age 50, in fact, to age 80s and beyond.
The fact that the AMD was an extreme medical rarity between 1851 and 1930, when processed food consumption had recently begun (1880) and was elevating, lends much further support to the hypothesis that AMD is a disease of processed food consumption, just as our supportive data in 25 nations confirms.
References
- Knobbe, CA. (2016) Ancestral Dietary Strategy to Prevent and Treat Macular Degeneration. Springville, Utah: Vervante Corporation, pp. 14-30. ↑
- “Life expectancy,” Wikipedia, (n.d.). Retrieved from: https://en.wikipedia.org/wiki/Life_expectancy. ↑
- “Jeanne Calment,” Wikipedia, (n.d.). Retrieved from https://en.wikipedia.org/wiki/Jeanne_Calment ↑
- Price, Weston A. 2003. Nutrition and Physical Degeneration. La Mesa, CA: Price-Pottenger Nutrition Foundation. ↑
- “Japan,” Wikipedia, (n.d.), Retrieved from: https://en.wikipedia.org/wiki/Japan ↑
- Knobbe, CA. (2016) Ancestral Dietary Strategy to Prevent and Treat Macular Degeneration. Springville, Utah: Vervante Corporation, pp. 123-125. ↑
- Jones DS, Podolsky SH, Greene JA. The Burden of Disease and the Changing Task of Medicine. N Engl J Med 2012; 366:2333-2338 DOI: 10.1056/NEJMp1113569. ↑
- Ibid. ↑
- Cordain L, Eaton SB, Sebastian A, et al. Origins and evolution of the Western diet: health implications for the 21st century. Amer J Clin Nutr. 2005; 81(2)341-354. ↑
- “Social factors key to ill health.” BBC News. August 28, 2008. Presented August 28, 2008. Retrieved from: http://news.bbc.co.uk/2/hi/7584056.stm ↑
- Max Roser (2018) – “Life Expectancy”. Published online at OurWorldInData.org. Retrieved from: ‘https://ourworldindata.org/life-expectancy’ [Online Resource] ↑
- Max Roser (2018) – “Child Mortality”. Published online at OurWorldInData.org. Retrieved from: ‘https://ourworldindata.org/child-mortality’ [Online Resource] ↑
- Cellania M. “The Historical Horror of Childbirth.”(May 9, 2013) MentalFloss.com. Available from: http://mentalfloss.com/article/50513/historical-horror-childbirth ↑
- Lancaster HO. Expectations of Life A Study in the Demography, Statistics, and History of World Mortality. New York, NY, Springer-Verlag, p. 8. ↑
- Jaques, R. Kevin. (2006). Authority, Conflict, and the Transmission of Diversity in Medieval Islamic Law. Brill Publishers., p. 188. ISBN 978900414754. ↑
- Ahmad, Ahmad Atif (2007), “Authority, Conflict, and the Transmission of Diversity in Medieval Islamic Law by R. Kevin Jaques,” Journal of Islamic Studies. 18(2):246-248, doi:10.1093/jis/etm005. ↑
- Bulliet, Richard W. (1983), “The Age Structure of Medieval Islamic Education,” Studia Islamica, 57:105-117, doi:10.2307/1595484. ↑
- Shatzmiller, Maya (1994), Labour in the Medieval Islamic World, Brill Publishers, p. 66, ISBN: 9004098968. ↑
- Guyenet S. “Mortality and Lifespan of the Inuit.” Whole Health Source, (July 5, 2008), Retrieved from: http://wholehealthsource.blogspot.com/2008/07/mortality-and-lifespan-of-inuit.html ↑
- Gurven M, Kaplan H. Longevity Among Hunter-Gatherers: A Cross-Cultural Examination. Population and Development Review, 29 May 2007, https://doi.org/10.1111/j.1728-4457.2007.00171.x ↑
- “List of Presidents of the United States by date of death,” Wikipedia, (n.d.). Retrieved from: https://en.wikipedia.org/wiki/List_of_Presidents_of_the_United_States_by_date_of_death ↑
- “List of Presidents of the United States,” Wikipedia, (n.d.). Retrieved from: https://en.wikipedia.org/wiki/List_of_Presidents_of_the_United_States ↑
- “Hippocrates Biography.” Biography, (n.d.), Retrieved from: https://www.biography.com/people/hippocrates-082216 ↑
- Knobbe, CA. (2016) Ancestral Dietary Strategy to Prevent and Treat Macular Degeneration. Springville, Utah: Vervante Corporation, p. 21. ↑

Recent Comments